FigJam
Inspire insight with the logical data model
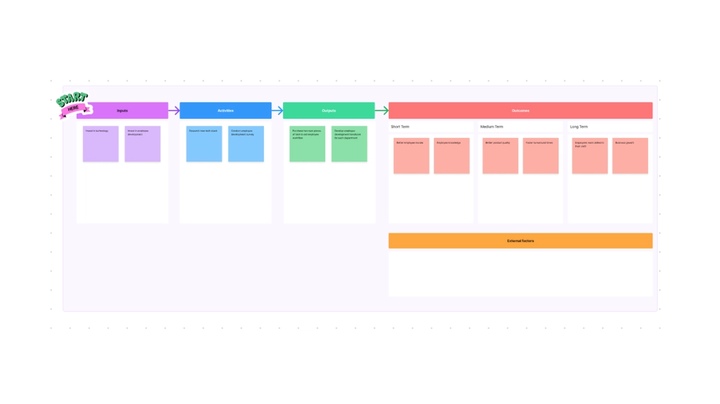
Identify data collection points on a customer journey or process map, then refine the details with logical network models to take your data storage to the next level.


Logical data model
Structure your data and share its story on our collaborative logical model example.

No datum left behind
Connect the data dots to understand how different elements and outcomes relate.
Establish shared motivations: Help your team understand how collaborative effort translates into favorable metrics.
Find surprising connections: Discover new insights in old data and refine your game plan to reflect your findings.
See the big picture: Gather key information points to build on wins, analyze losses, and strengthen strategy.


FigJam
Scaling up? Knock your strategy out of the park
As your business grows, so does your data. Bring your entire team to the strategy room with our shared whiteboards, cursor chats, and audio recording functions. FigJam makes it easy to organize incoming data as you’re scaling so you can swing for the fences.
Don’t leave it a data dump
Build a strong foundation for your database with our customizable logical diagram example. Ensure your systems run smoothly with more templates from our Community.


FAQs
The logical data model serves as a blueprint for categorizing your data and showing the relationship between various datasets. It’s one of the multiple visualization frameworks in the toolkit of every business analyst and data architect, and it can be useful for all kinds of teams.
Whether you’re scaling up or just getting started, you’re probably accumulating data. Organizing all of your information and finding the connections between data sets can help you keep your facts straight and uncover new insights.
Between conceptual, physical, and logical data models, there are several ways to model your data and discover insights. A conceptual data model has the broadest scope, roughly mapping out data collection points in your company’s overall business process, for example, during payment or registration.
When it comes to logical vs physical data model uses, the two represent sequential steps in a data modeling framework. The logical data model helps you understand what data exists and how it connects. The physical data model then visualizes a database to store this information so it’s easily retrievable by the user.
Begin your logical network diagram with key categories representing your collected data. For example, if you run a retail business, significant categories include “customer” and “store.” Then, write out relevant attributes for each category. Each customer may have an associated name and username. Each store may have an identification number and address. Once you’ve settled on the categories and attributes, sketch out the connections between them.
Turn your logical data model into a collaborative process so you don’t miss the details. Ready to begin? Download our free logical data model example and start editing together.
Explore 1,000+ templates on the Figma community
Explore even more templates, widgets, and plugins—all built by the Figma community.

