Collaborating in FigJam
Collaboration—it’s hard to define, but easy to feel. When the right people get together with the tools they need, conversations flow more easily, ideas grow faster, and work just seems to work. We built FigJam, our online whiteboard, to help teams collaborate and work better together across projects, disciplines, and geographies.
In this guide, I’ll walk you through best practices and share strategies for collaborating in FigJam throughout the entire design process—from your first brainstorm to your final review.
Brainstorming
The brainstorming phase of a project is an exciting one. But underneath that blank slate feeling, the key to a successful brainstorm is structure and preparation. Here are a few steps to organize your brainstorm and ensure that your team is empowered by possibility, not overwhelmed by it.
Choose a template
First, you need to define the purpose of your brainstorm and arrive on a few goals. Being crisp about what you're looking to get out of the session will help you choose the right template, or create one of your own. To get you started, we’ll walk you through a few templates from the Figma Community: Mind Map, Crazy 8s, and Brainstorms.
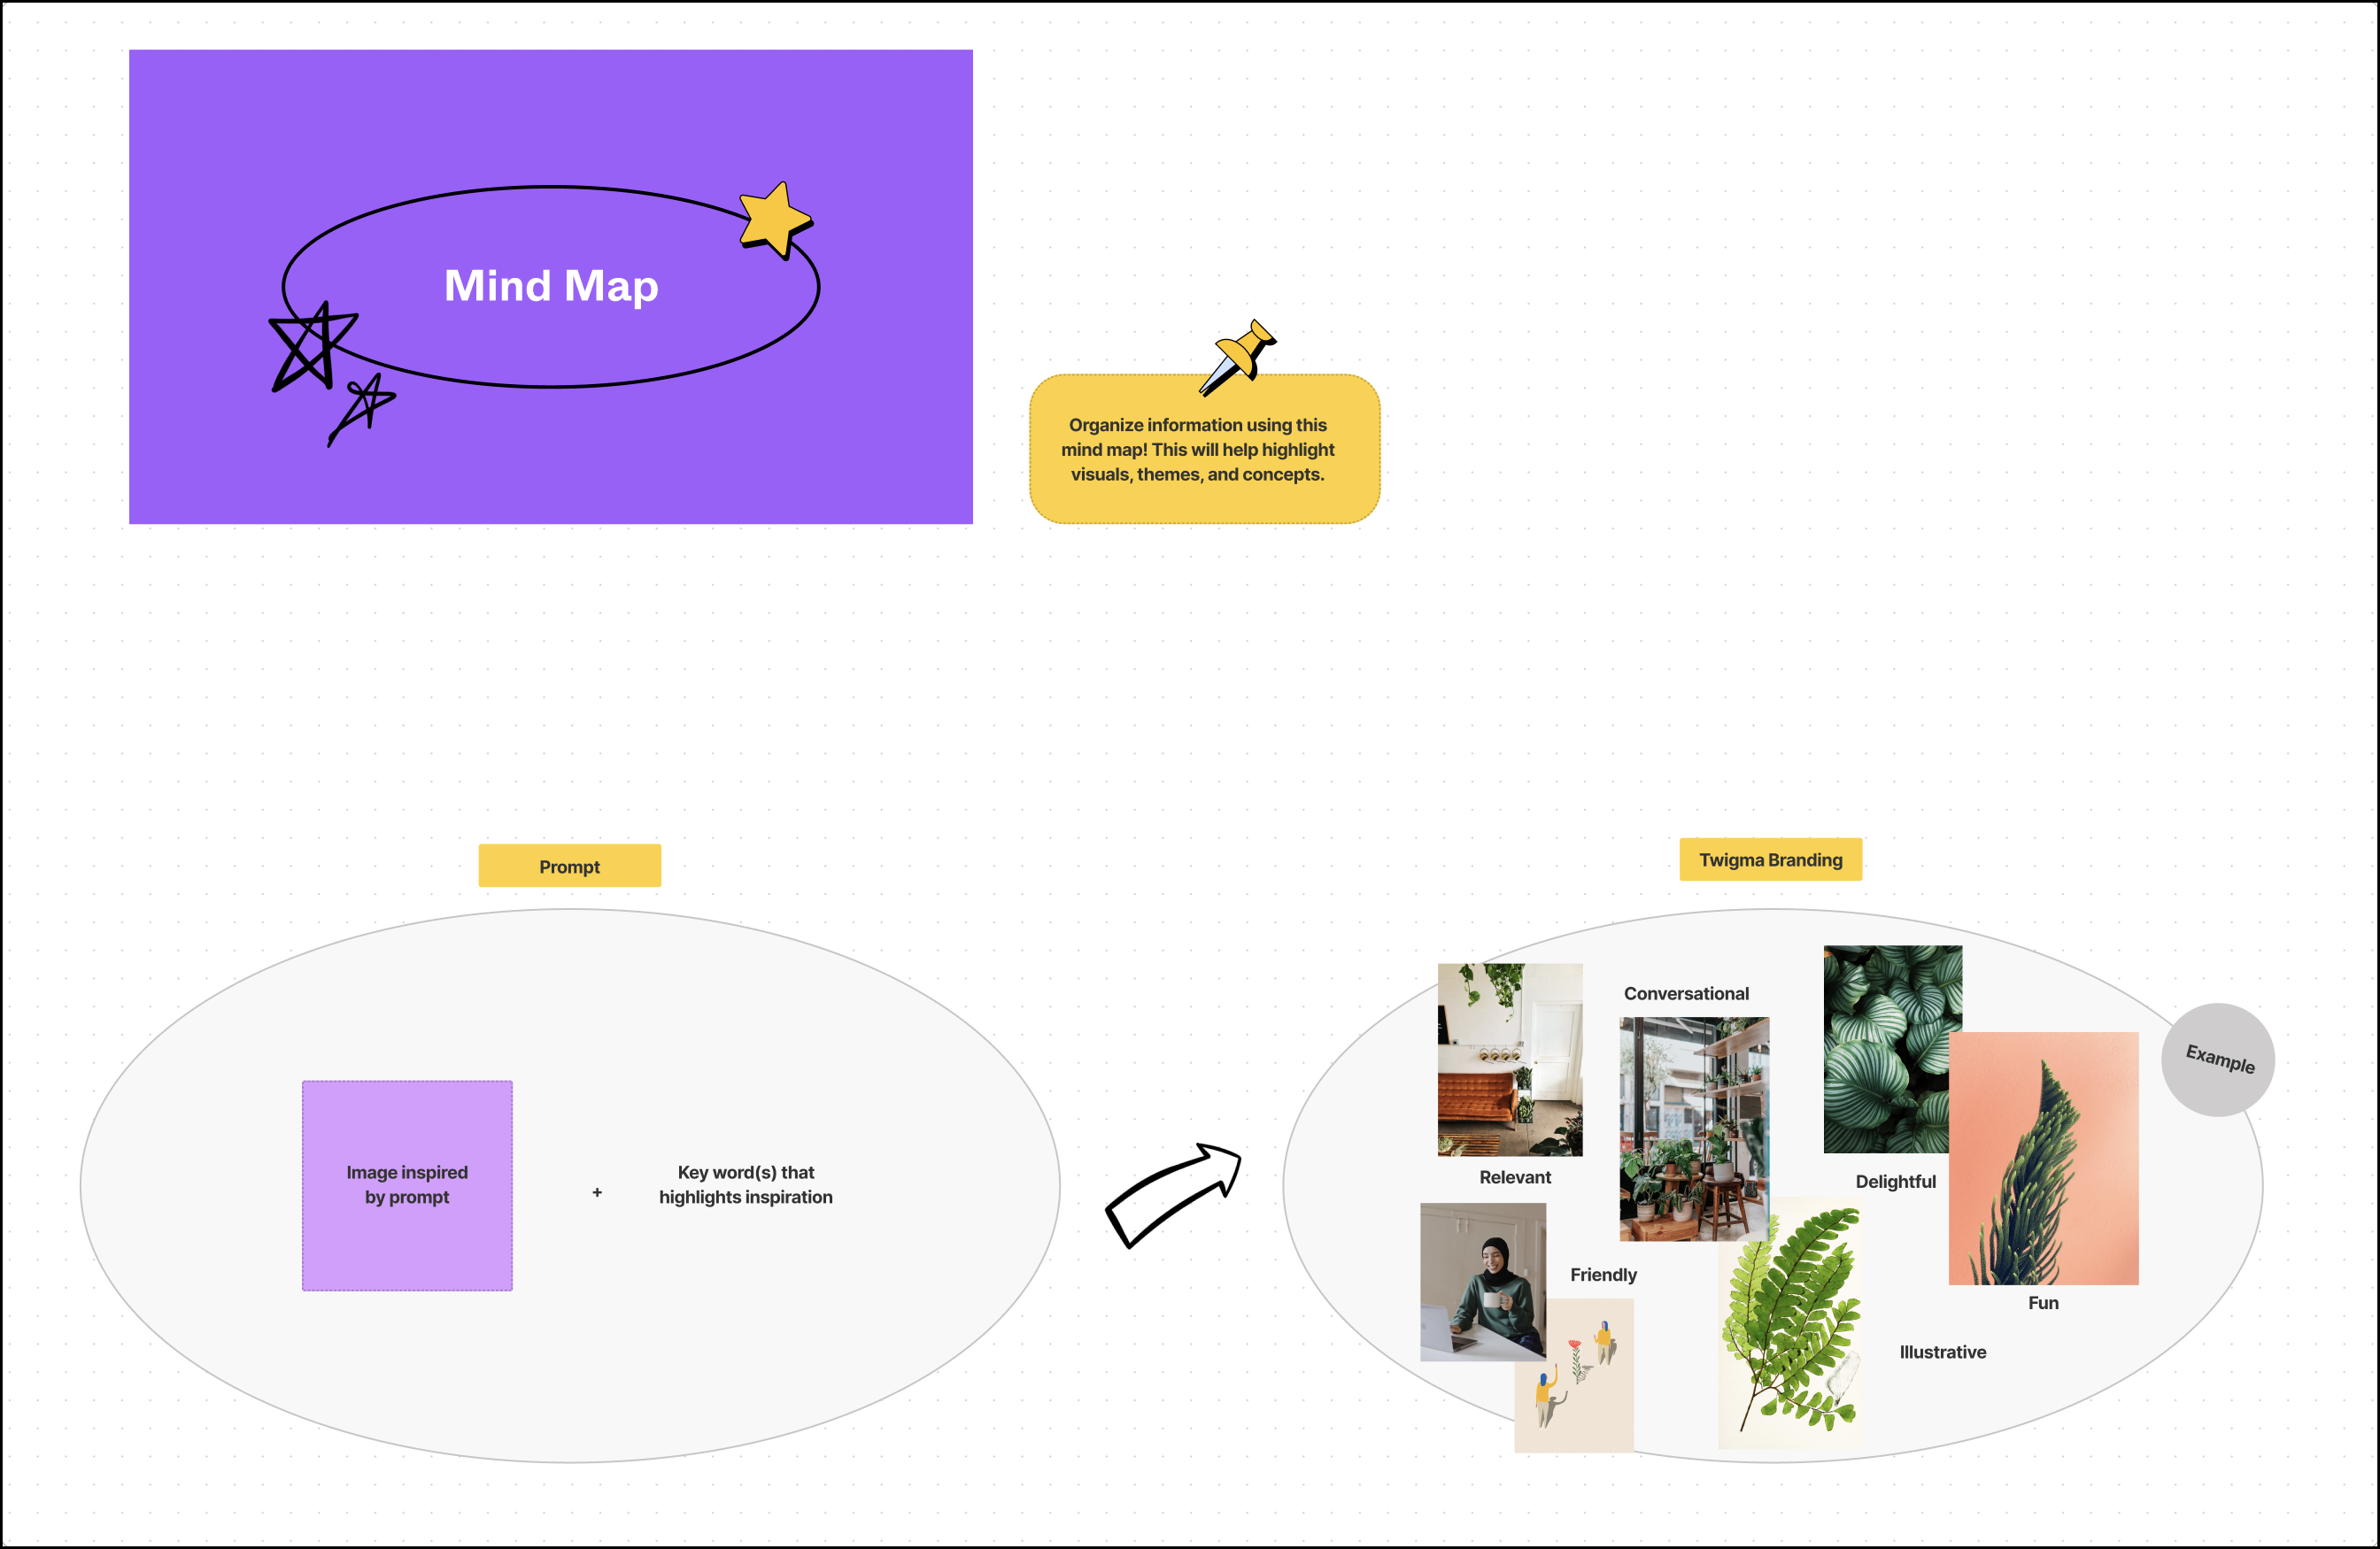
Mind Map is great for visualizing concepts and organizing inspiration. In this exercise, your team groups images inspired by a specific prompt and comes up with keywords that highlight emerging themes.

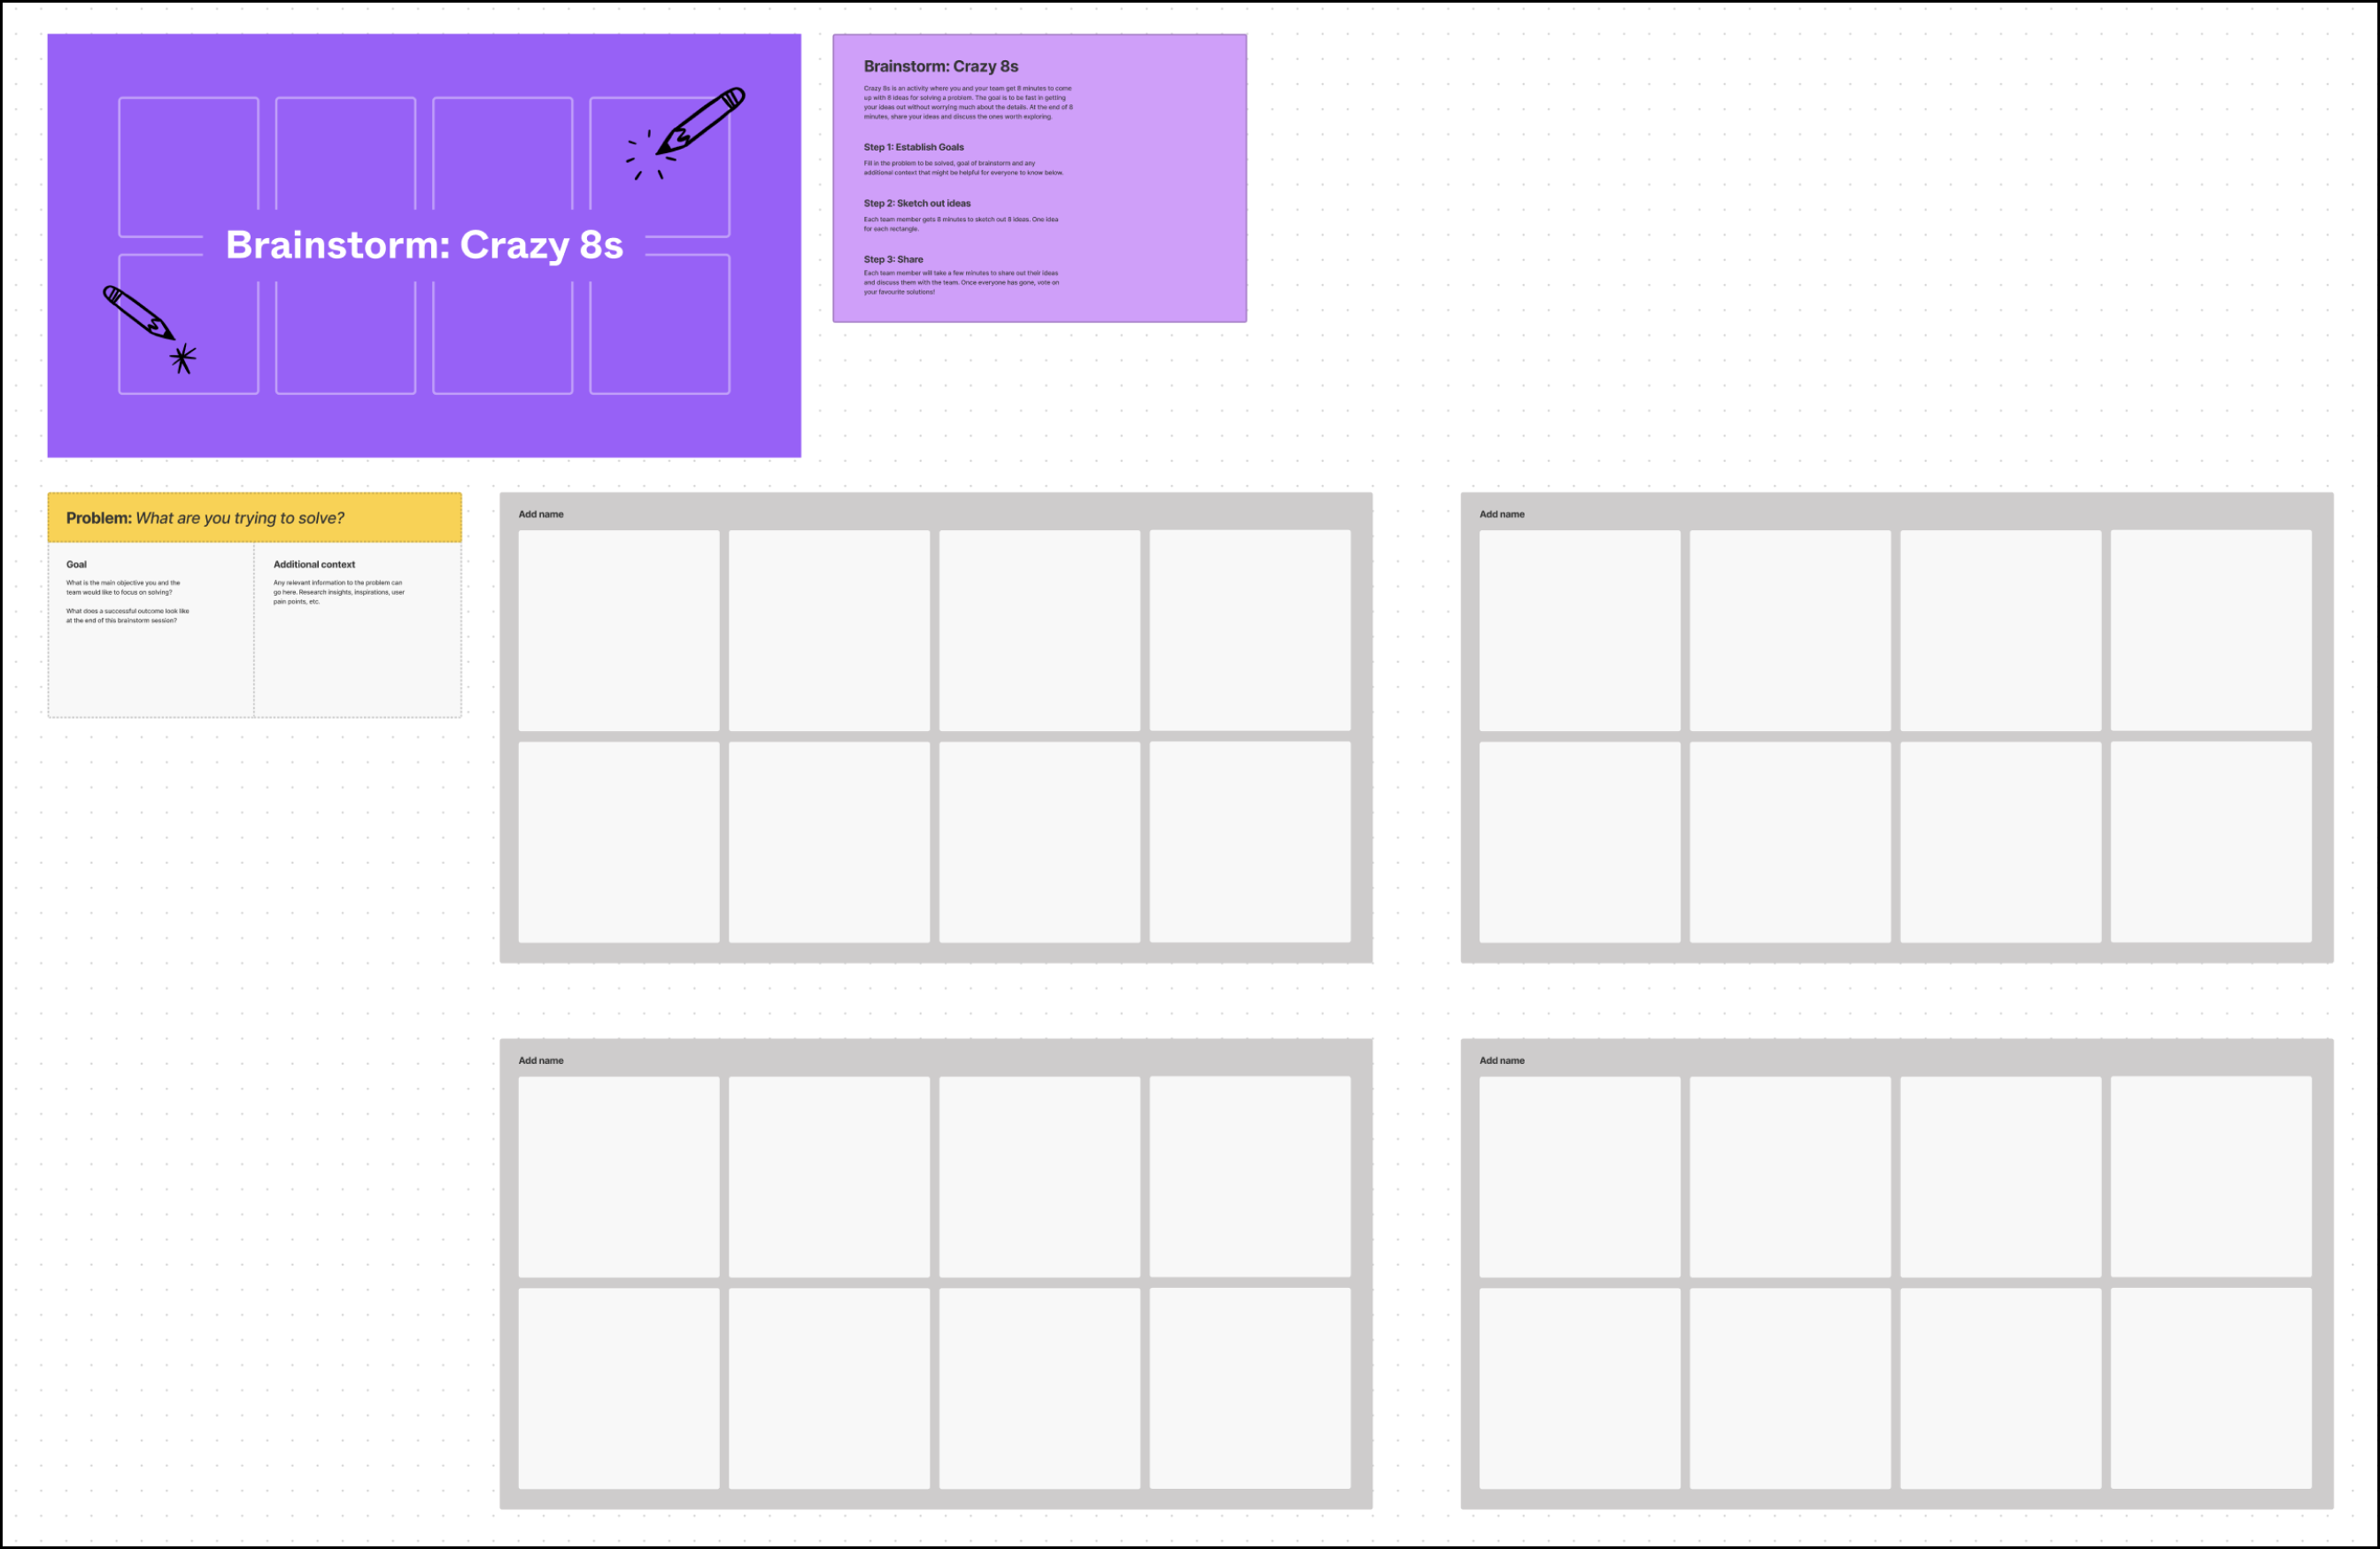
In Crazy 8s, your team has eight minutes to come up with eight ideas for solving a given problem. For example, you might prompt exploration with the question, “how might we make this experience delightful for our users?” The goal is to quickly generate ideas without getting too caught up in details or practical implementation. At the end of eight minutes, each teammate shares their ideas and discusses the ones they’d like to explore further.

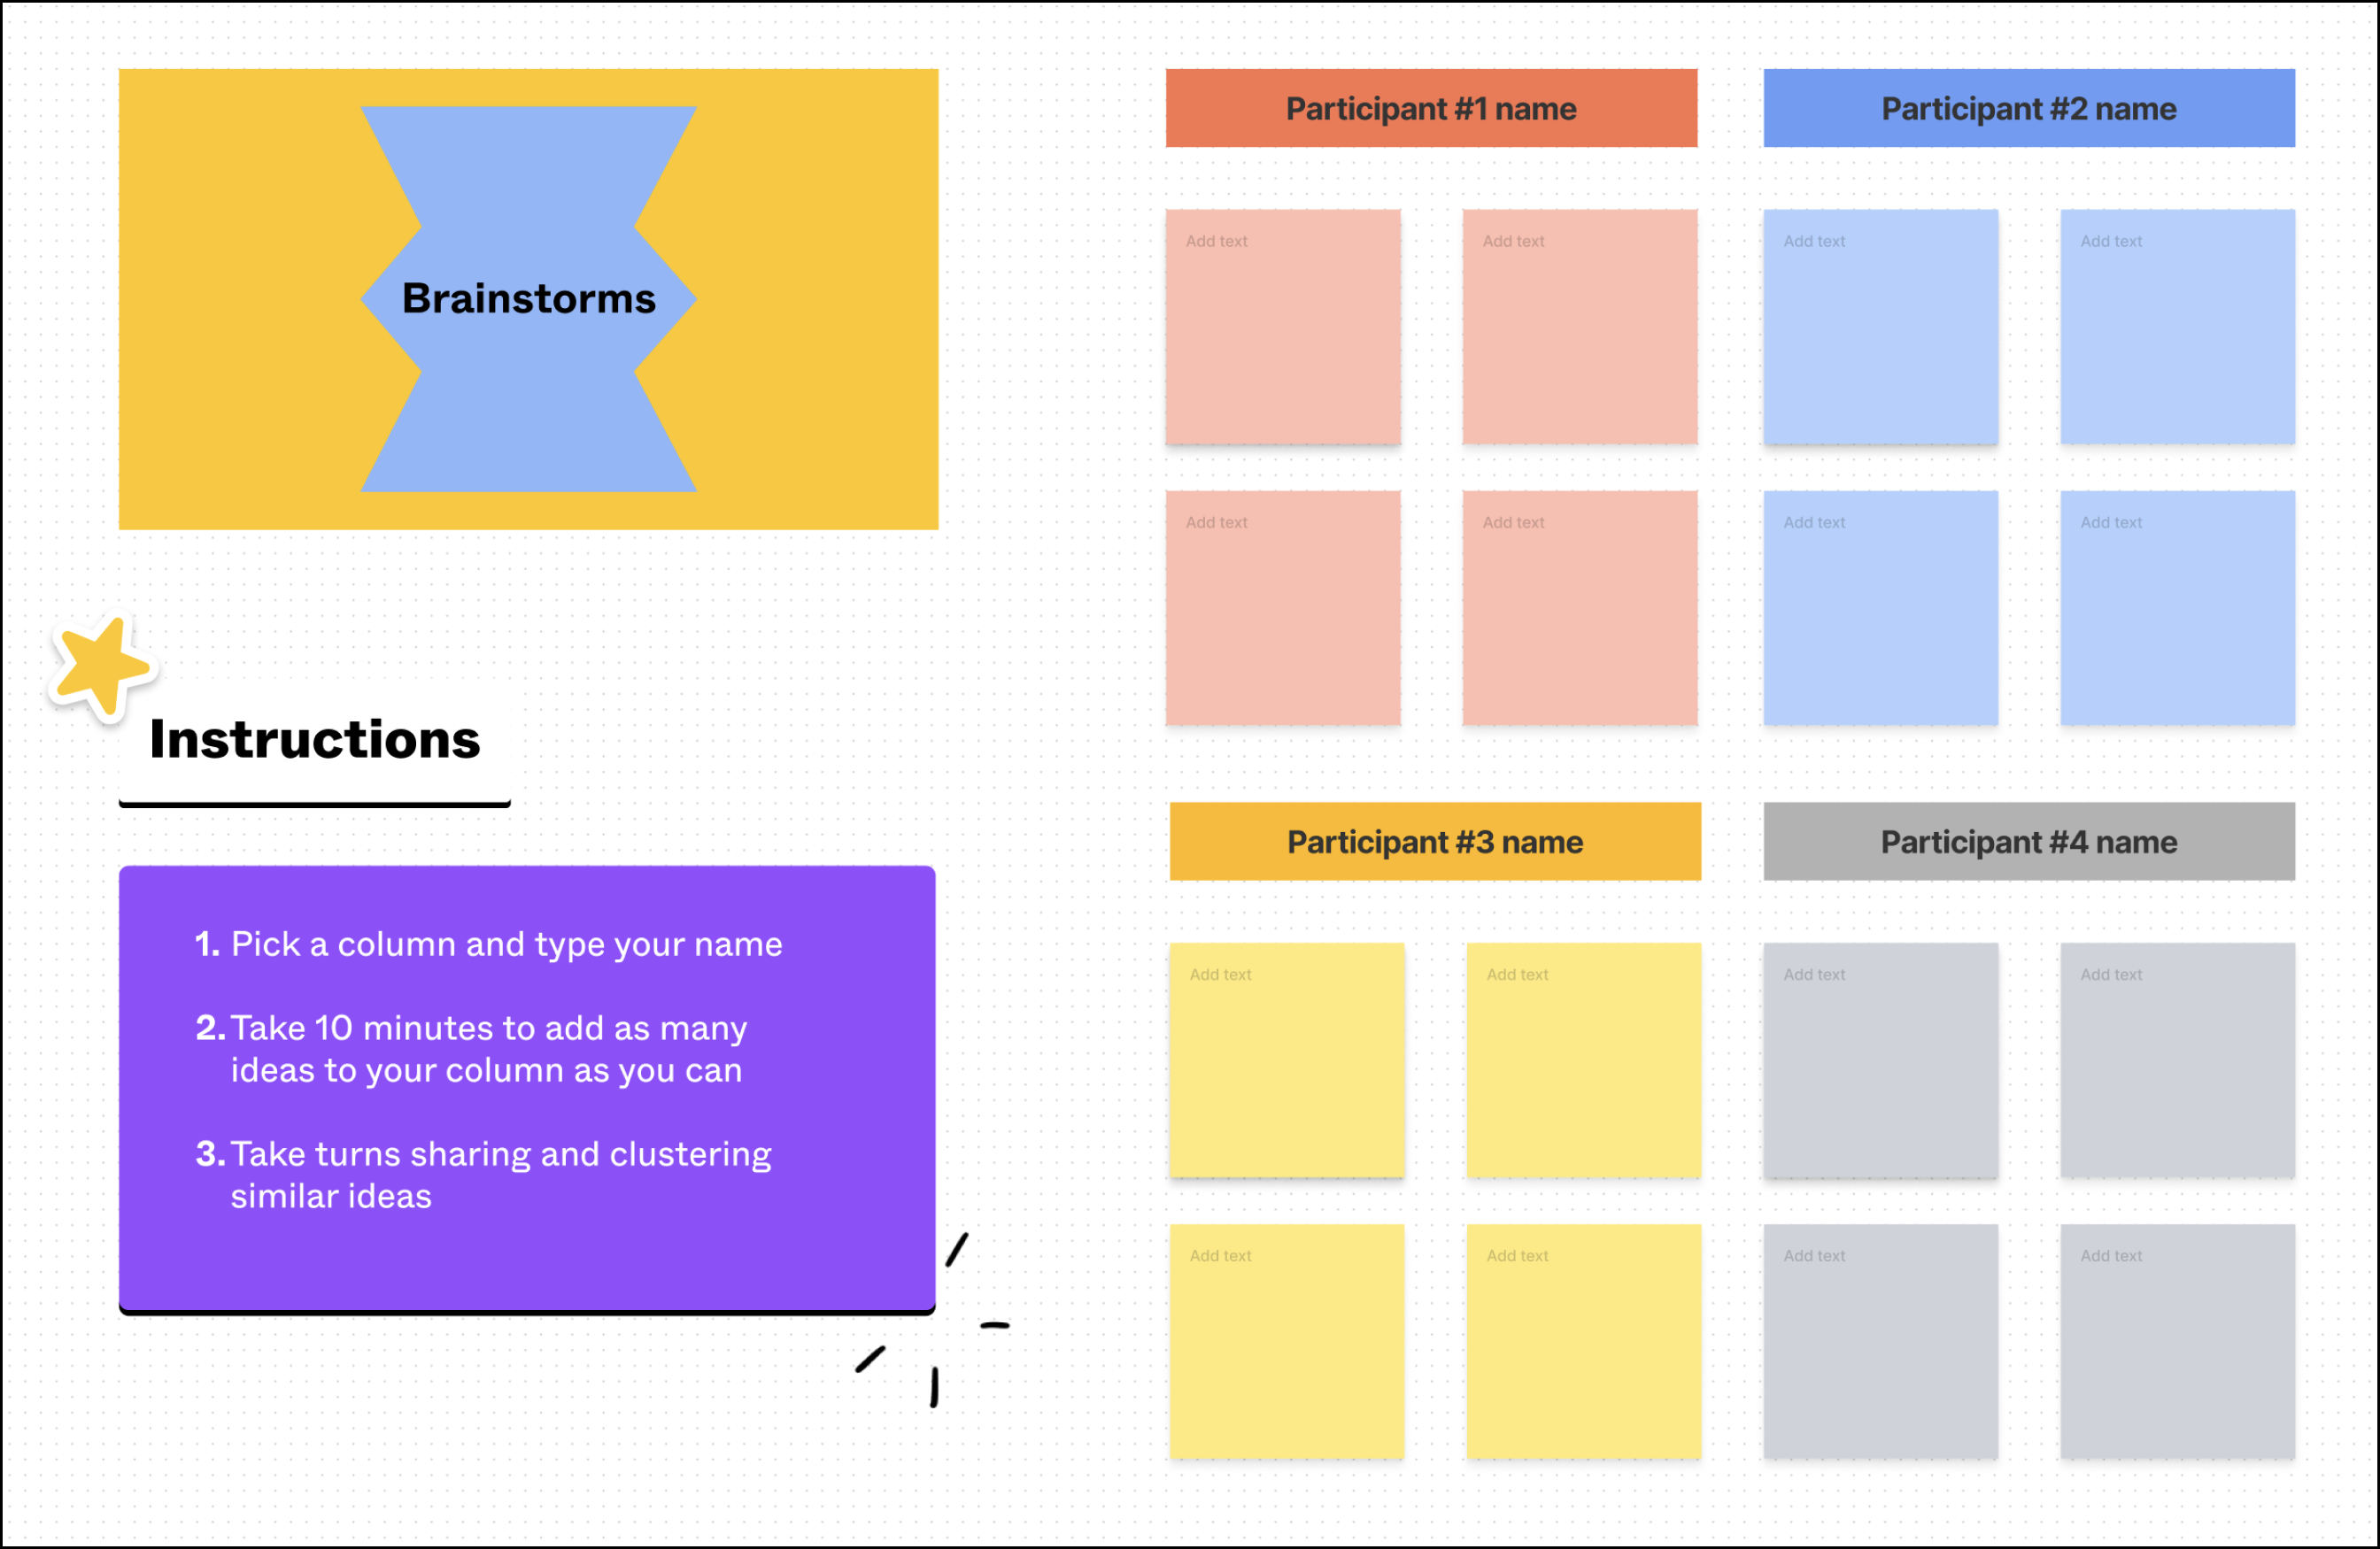
This Brainstorms template encourages each participant to individually come up with as many ideas as possible. At the end of the session, the group comes back together to deliberate and identify common themes.

Create a space in FigJam
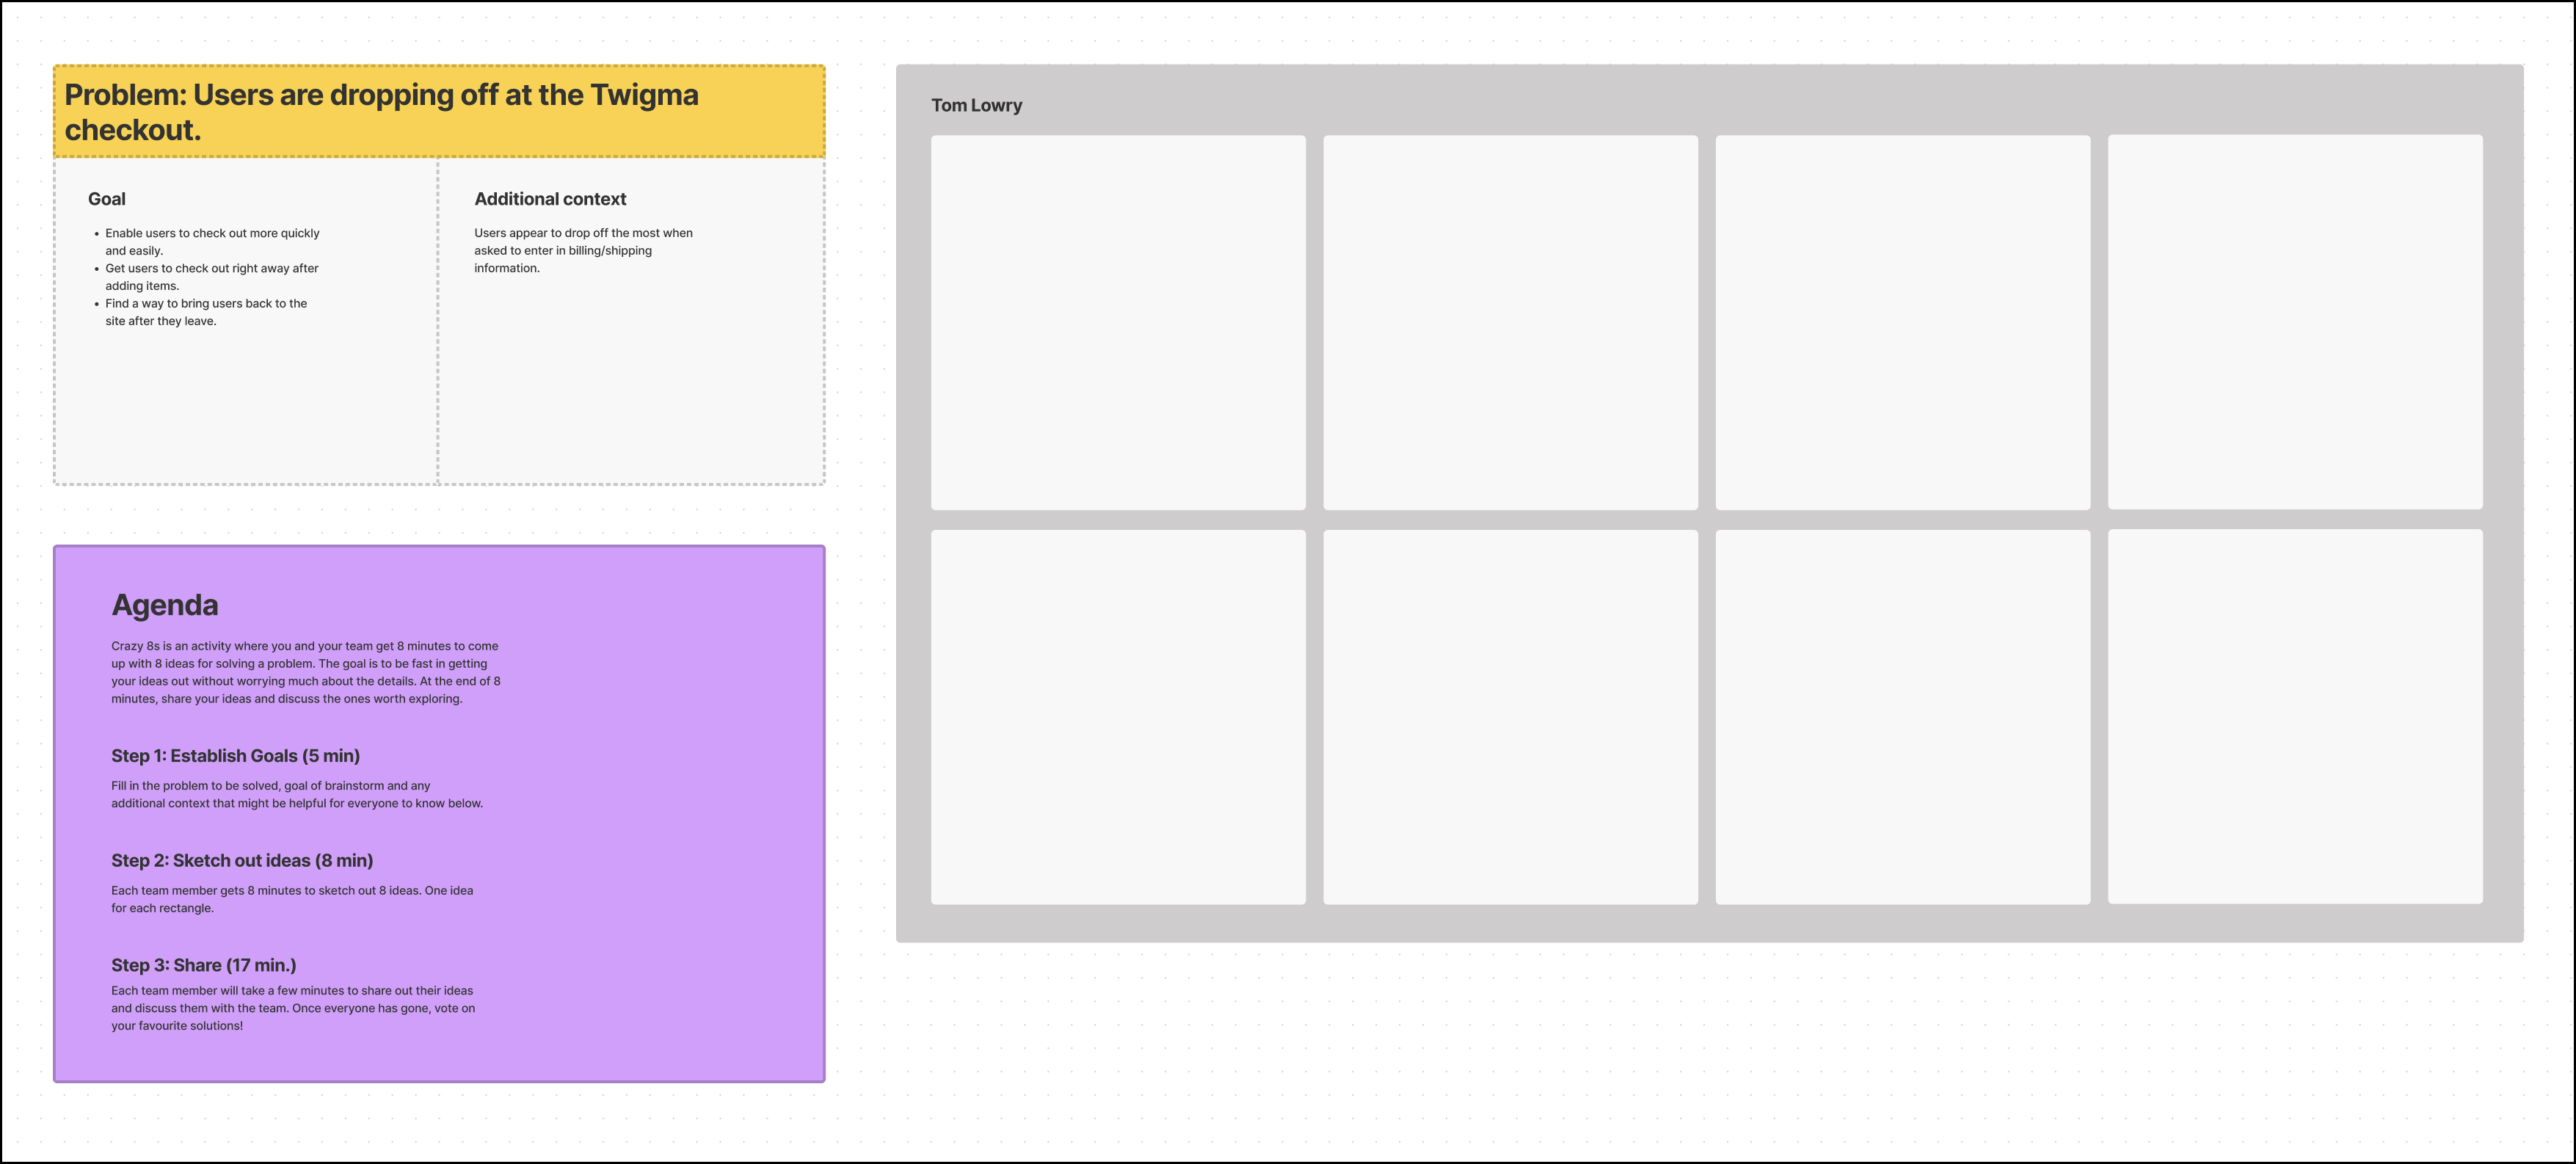
To help your brainstorm session run smoothly, it’s important to set up your FigJam file in advance. A well-prepared file should give everyone the context they need to be successful, including the purpose of the brainstorm, the agenda for the session, and instructions for each activity. While many templates include some of these elements, you should customize them to fit your needs. You can also save setup time by sharing a link to the FigJam file in advance.
If you have multiple exercises in a brainstorm, we recommend creating a separate space and time estimate for each to help your team stay on track. If the FigJam file is already organized, it’ll be easy for others to reference it later and navigate through the file independently.

Run the brainstorm
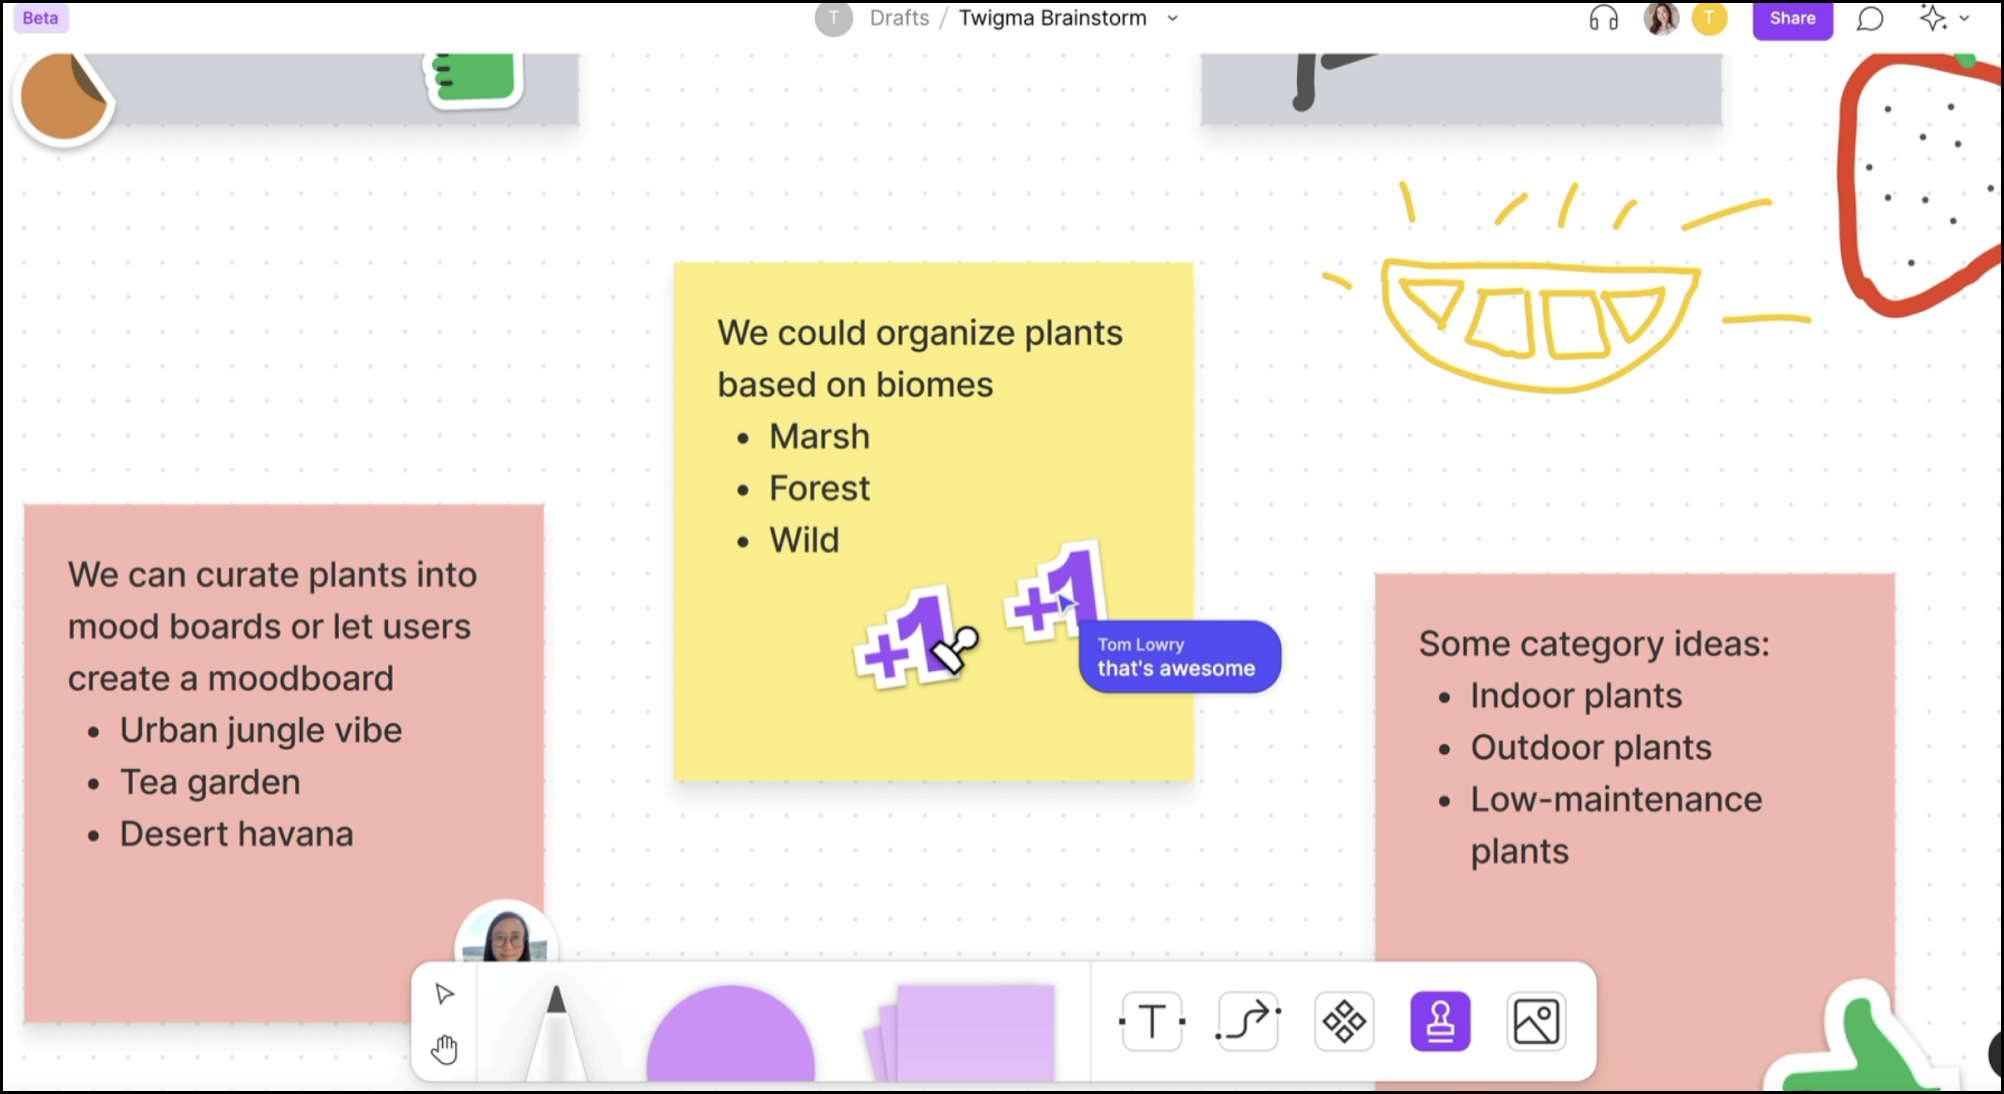
Now it’s time for the brainstorm. As the facilitator, it’s your job to keep the session moving and provide guidance along the way. Your participants should be doing most of the talking, sharing their ideas on stickies, drawing with the pencil tool, or pasting images and designs into FigJam. They can vote on ideas with stamps and stickers, or react to ideas in real time. Throughout the workshop, you can use FigJam’s built-in timer, audio chat, and cursor chat to communicate with your team without switching between FigJam and video conferencing tools—that way, you don’t distract them from the task at hand.
In the meantime, your participants should be engaging in conversations and letting their ideas flow. Participants can then vote on ideas as they're being presented.

Codify decisions
Depending on what you do with the ideas collected in your brainstorm, it might help to embed the FigJam file in your project documentation, export stickies populated with your brainstorm ideas to a CSV, or copy it over to a Figma design file.
Diagramming
Diagramming bridges the gap between ideation and implementation. It helps you get organized before you get going. While it might be tempting to skip this step, seeing everything laid out in a single place with connections and interactions can make the entire design process smoother.
To build a diagram in FigJam, drag in a few shapes from the toolbar, click the connector tool, and draw the connections between them. From there, customize your diagrams with different shapes, colors, strokes, and text. Once you have the hang of it, you can speed up the process by using the “+” icon to add more nodes with pre-built connectors.
Now that we’ve covered the basics, let’s dive into some specific use cases: sitemaps and user flows.
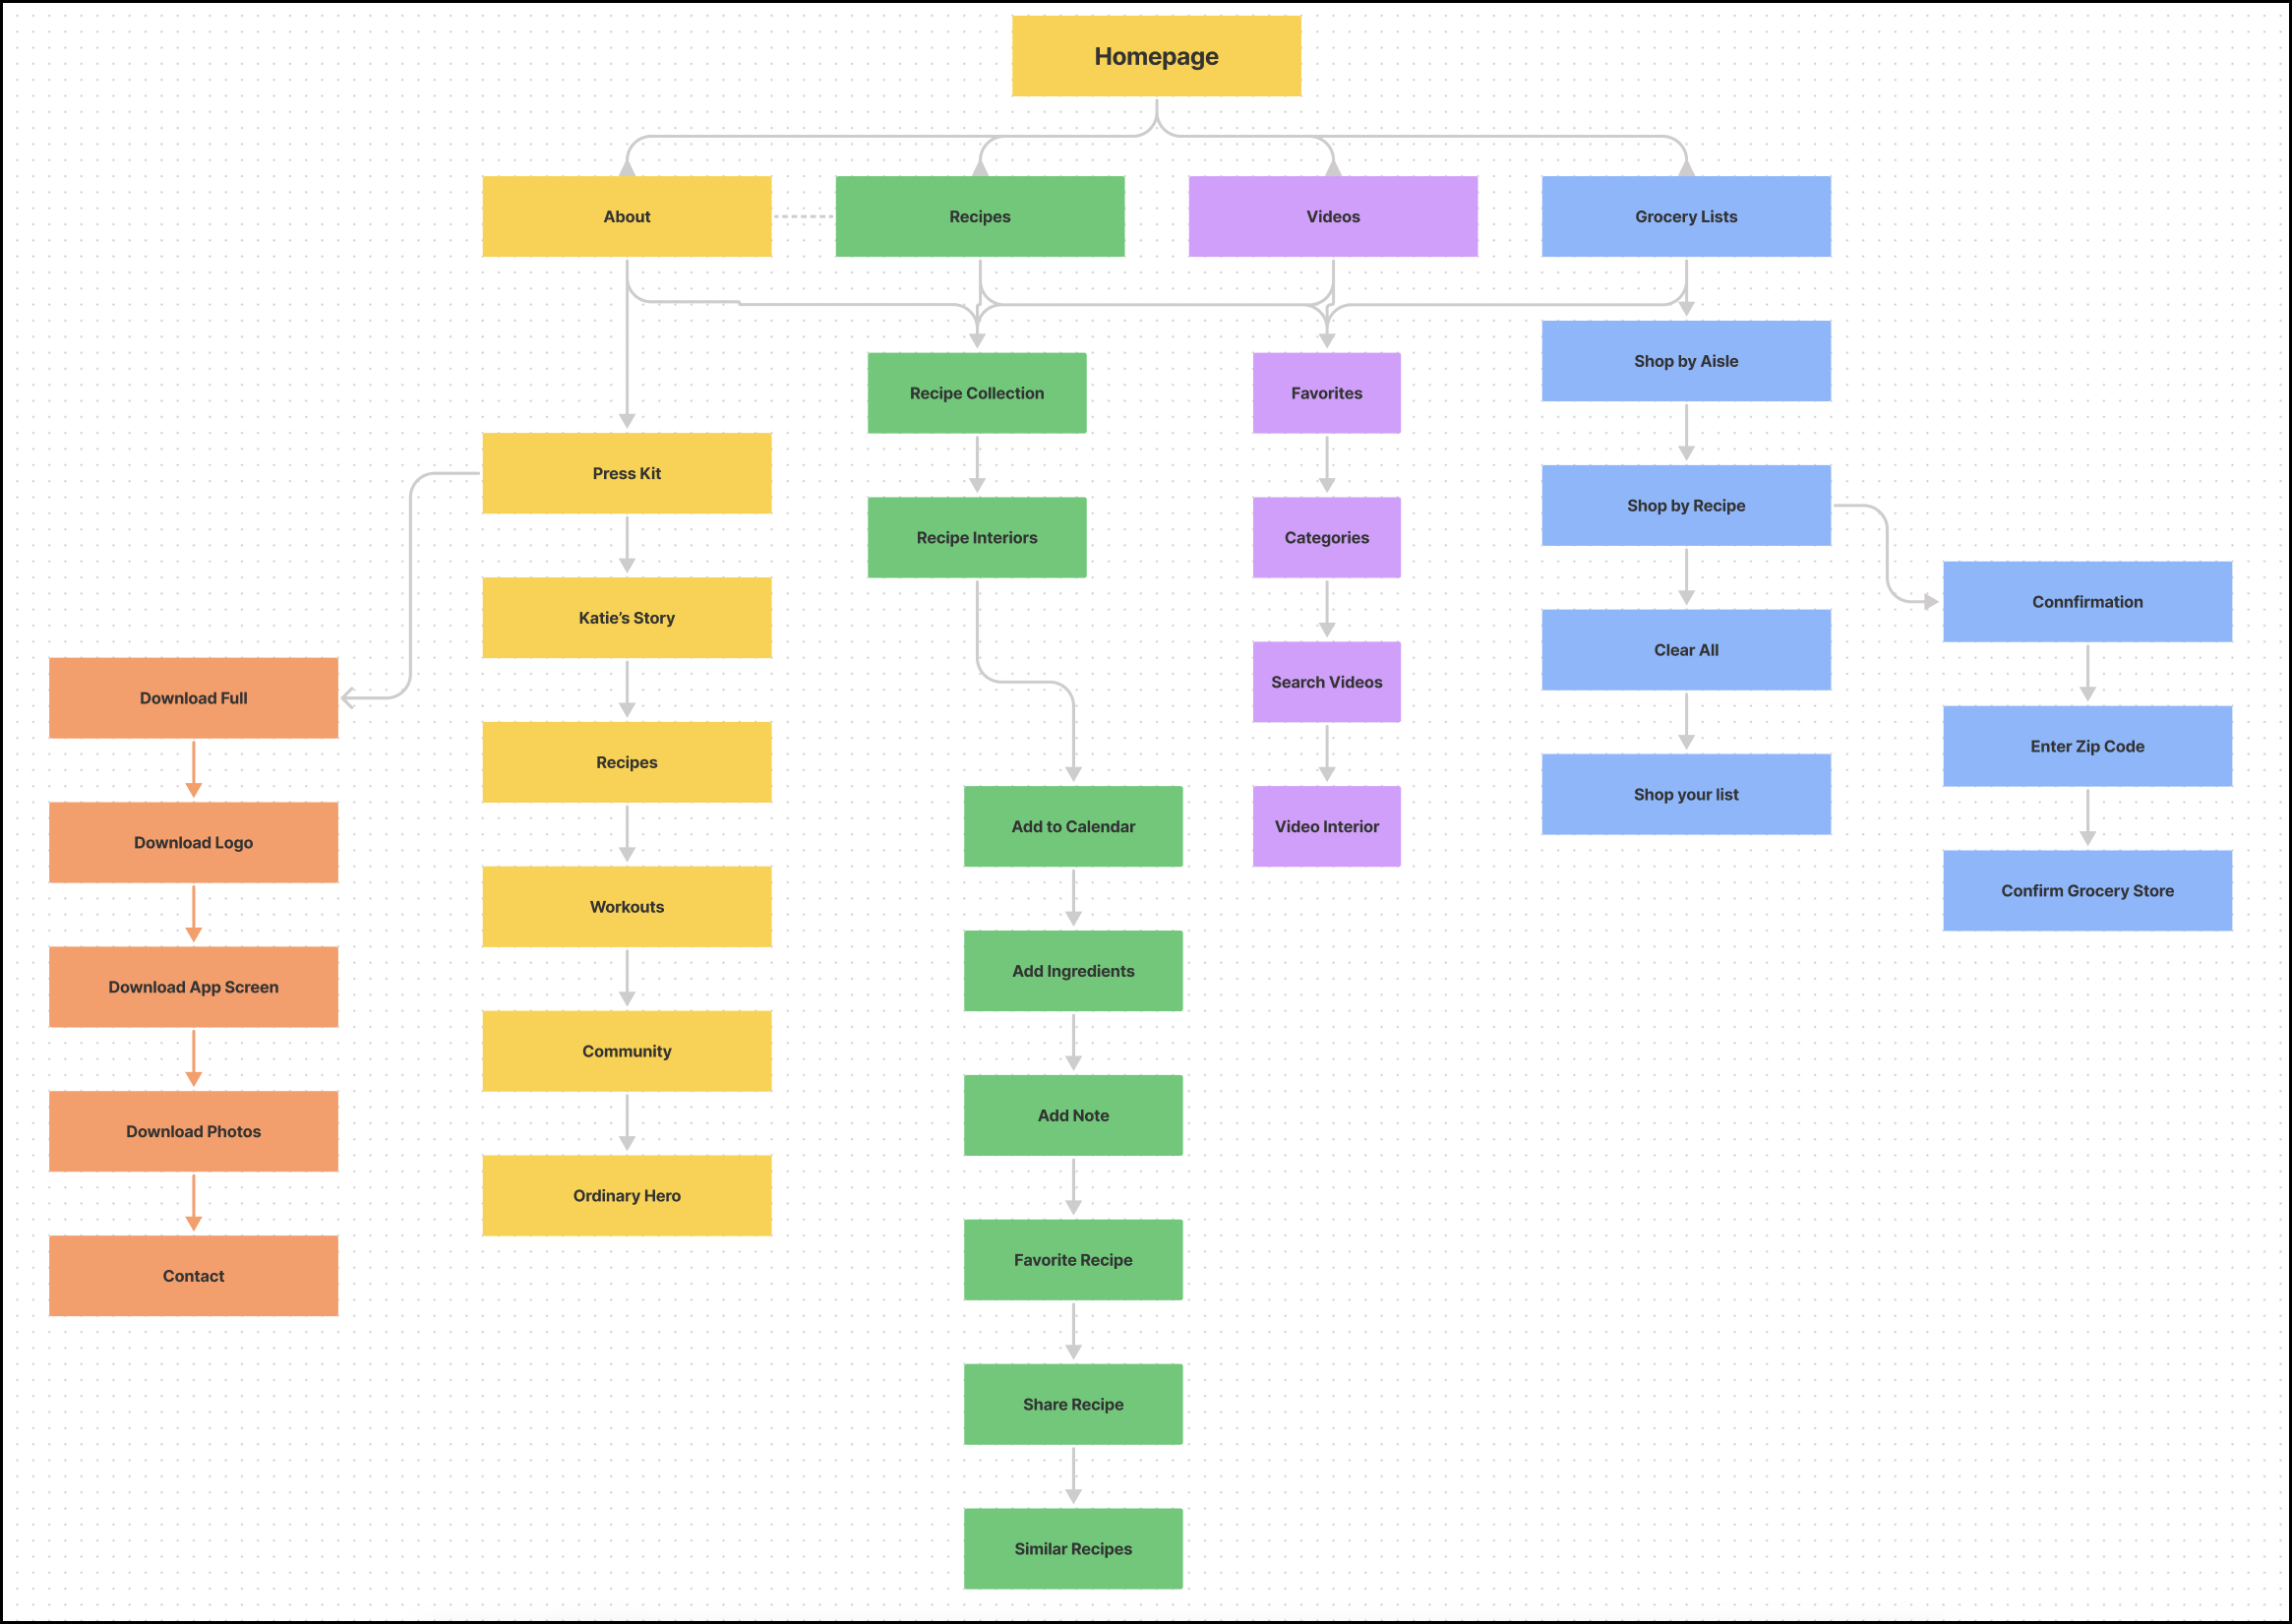
Sitemap diagrams
Sitemaps allow designers to think through the information architecture of a product at the highest level. This includes the priority and organization of your content, as well as the links that support user journeys (more on that below). A solid sitemap ensures that navigating your product is intuitive and that all of your content aligns with the product’s main goals.
Many designers are already familiar with building sitemaps, but what makes this process great in FigJam is that it’s built for collaboration. You can create sitemaps in real time alongside your product partners to investigate a new feature, think through high-level architecture, and map out specific feature interactions. Having your sitemaps so close to your designs has the added benefit of providing guidance as you develop your final screens in Figma. As your designs evolve, you can continue to update the sitemap diagram with your updates, linking specific Figma frames to nodes in your diagram. Alternatively, you can also export your sitemap as a JPG, PNG, or PDF to use in slides or documentation.

User flows
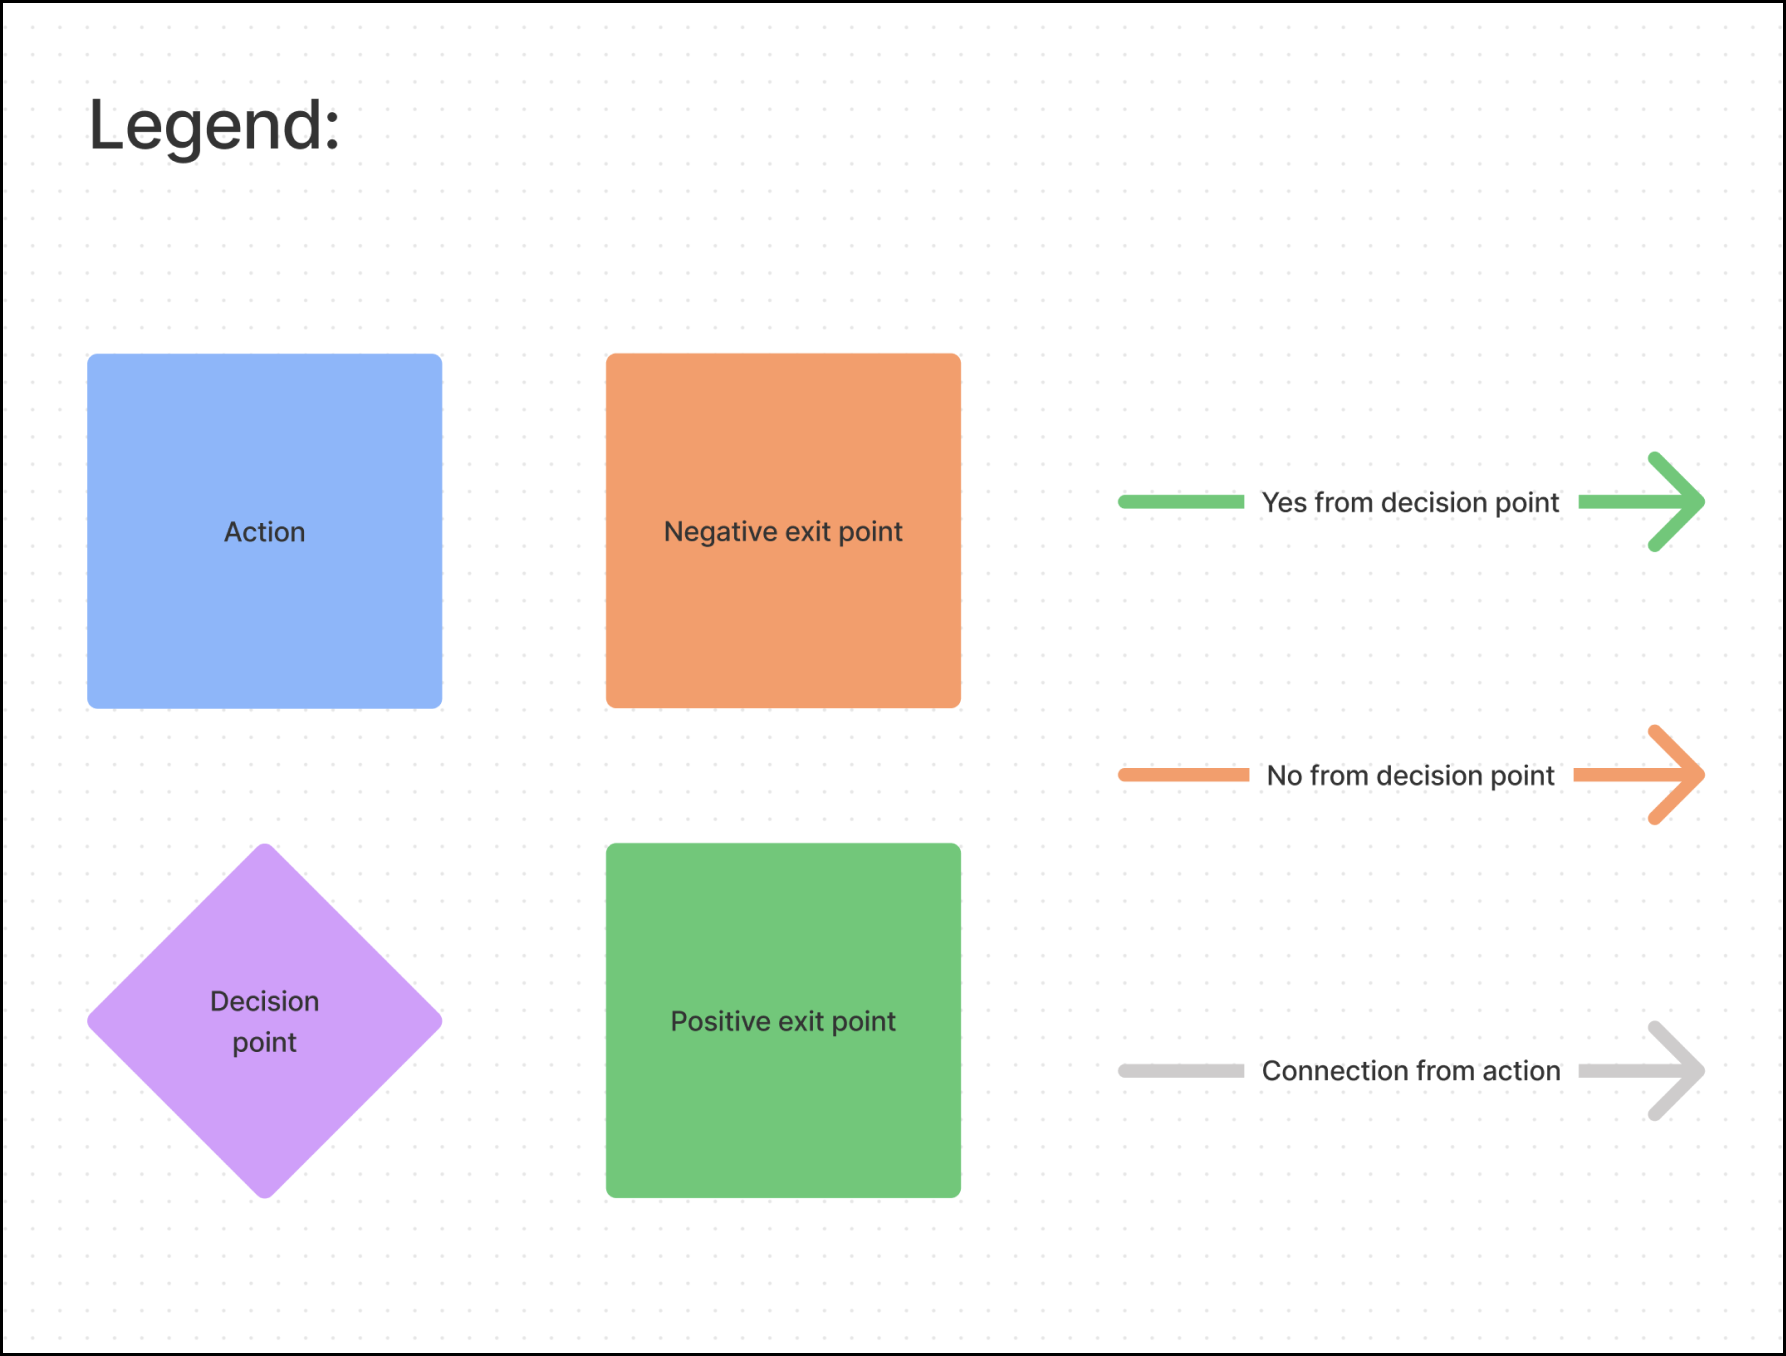
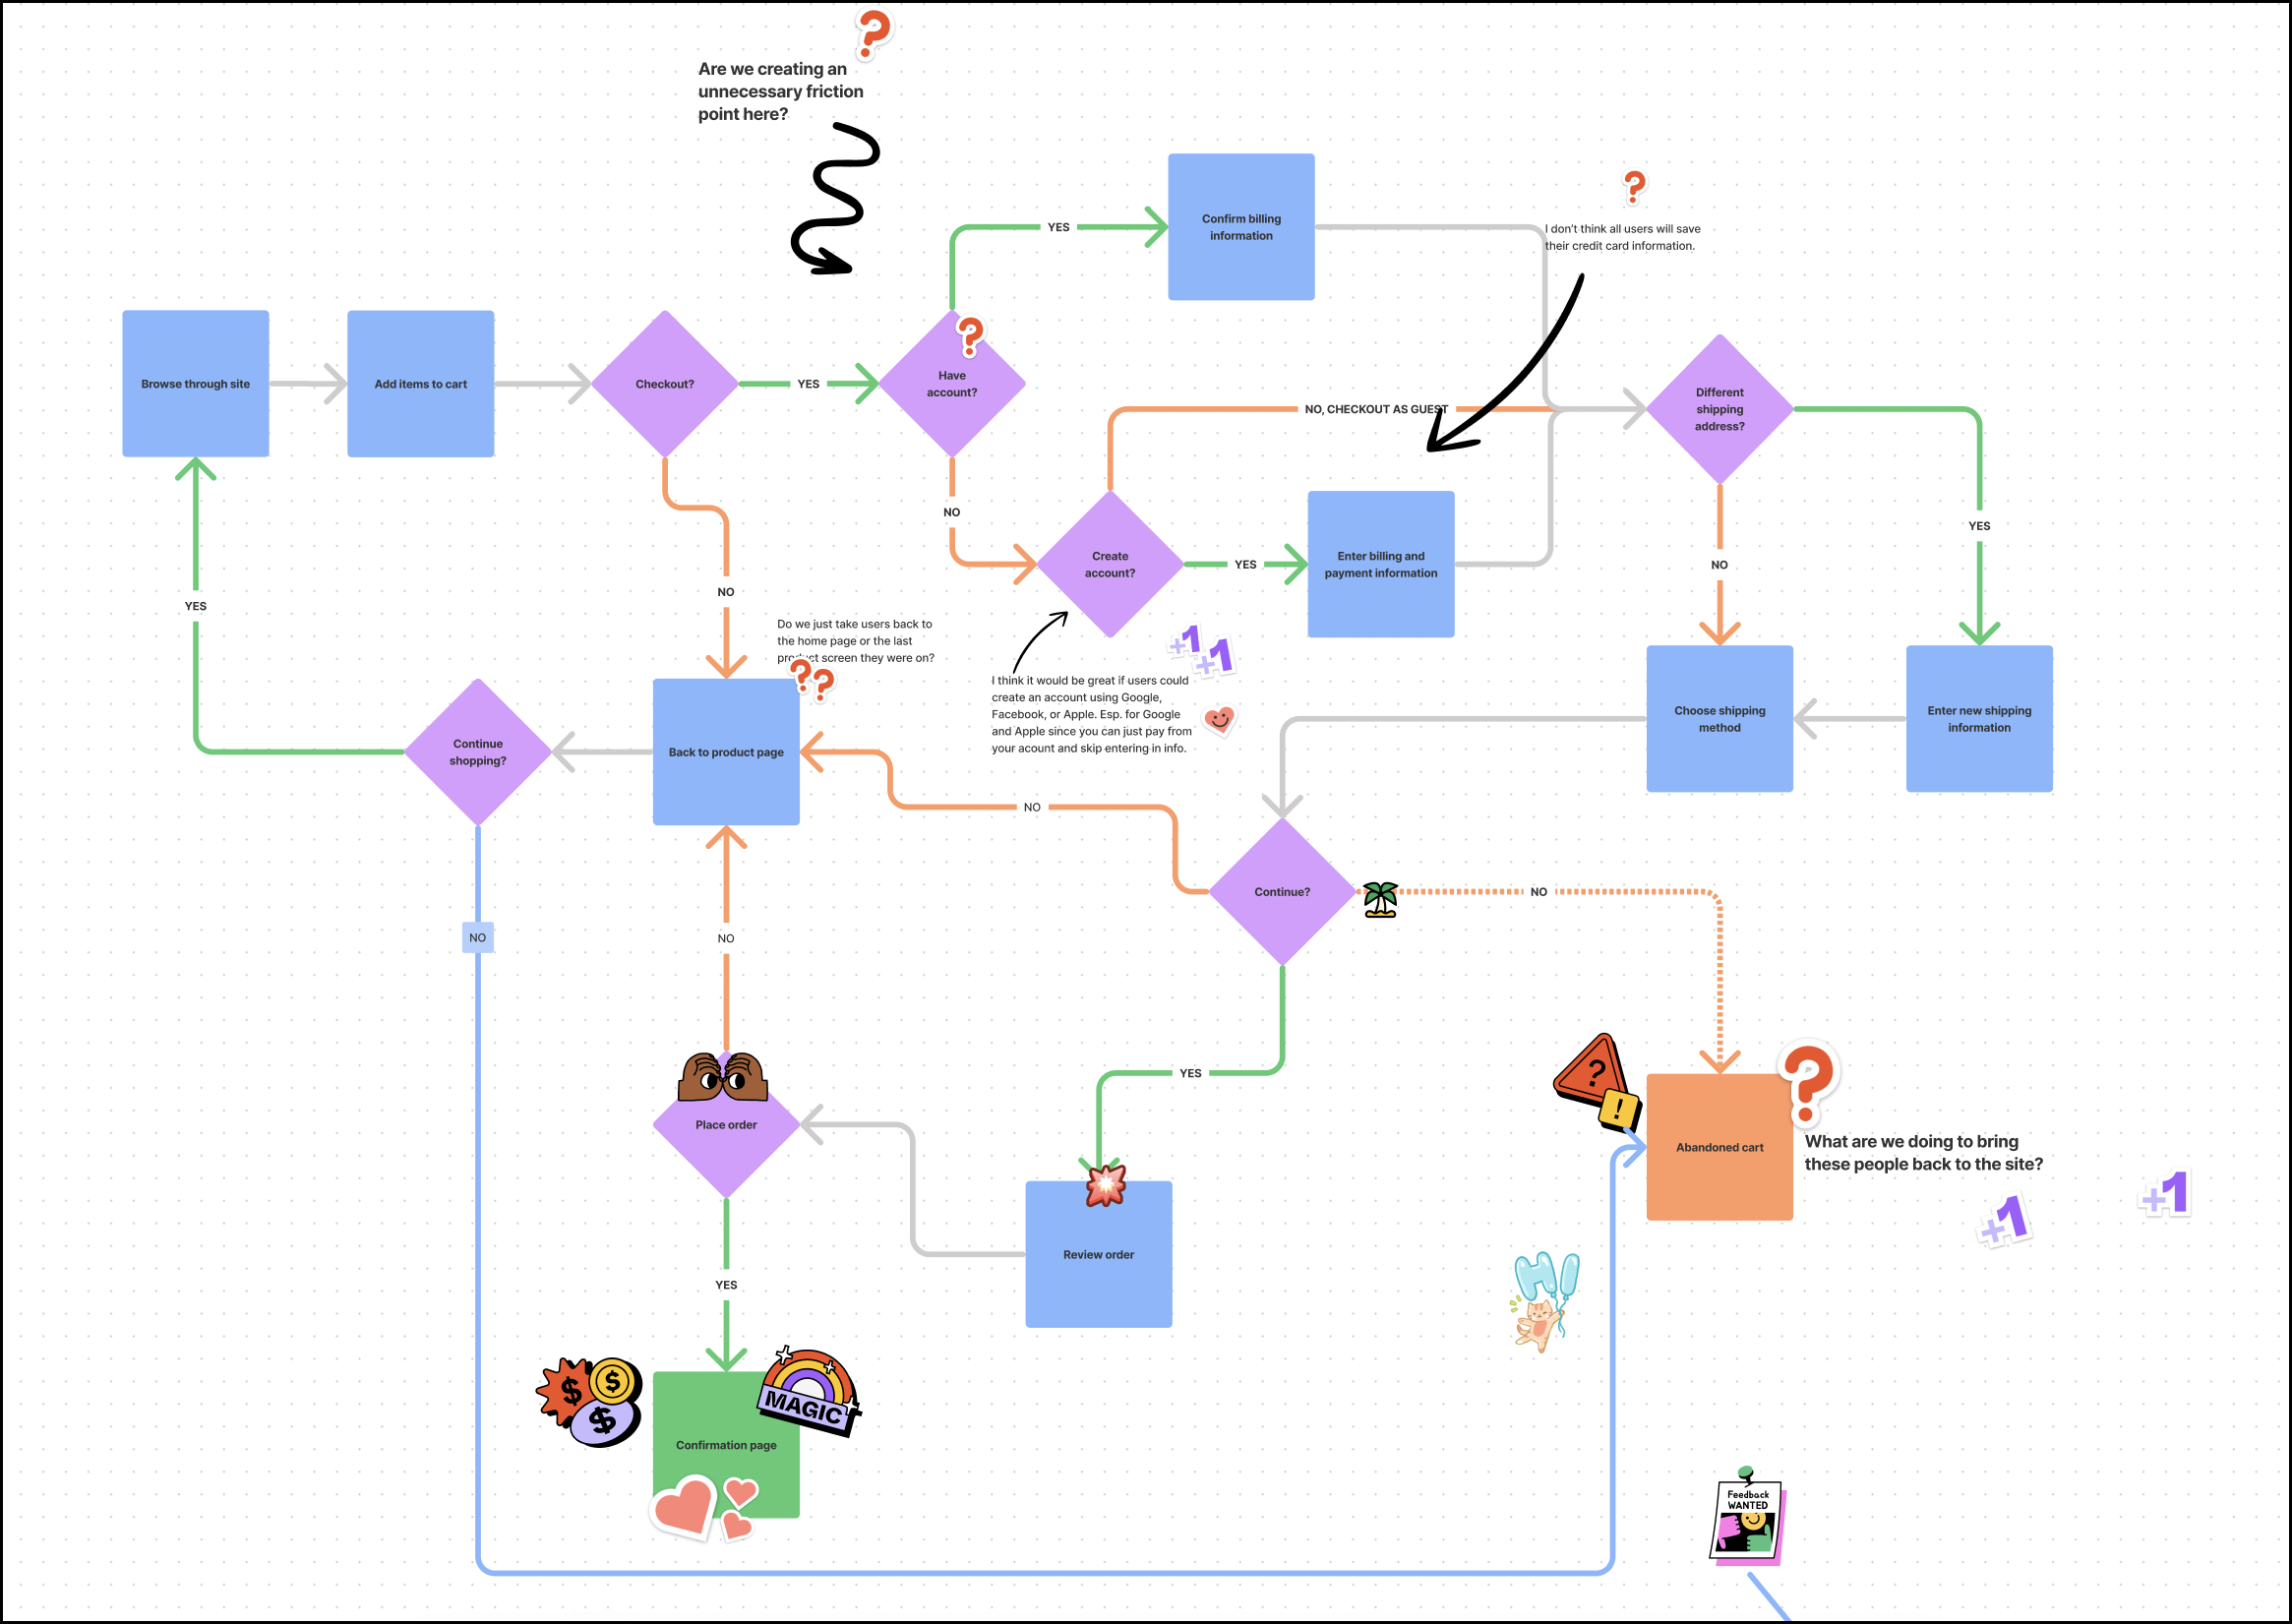
FigJam is also a great place to develop and test user flows, which map out the specific steps a user will take to navigate through your product. When building a new flow in FigJam, use shapes to represent individual product screens and connectors to represent user actions. You can further organize your diagram by color coding your shapes and connectors—like using color to indicate a screen’s depth in the site or a related feature. Similarly, you can use shapes to group your nodes and communicate their relationship with each other. Make sure you include a legend for your diagram to clarify what different colors and shapes signify.

After building out your diagram, you can also use FigJam’s text, stamps, and stickers to highlight specific parts of the user’s journey—for example, pain points, moments of success, or places where further design work is needed.

Feedback
Figma and FigJam are both great places to hold design reviews and solicit feedback. Depending on your goals for the session, there can be a few key advantages to moving your designs to FigJam.
- Altitude. By bringing your designs into FigJam, you can signal that you’re looking to keep things high level. Whereas in Figma, you might be tempted to design live or move components around in real time, FigJam elevates the conversation to keep things on track.
- Reactions. FigJam has tools like stickies, stickers, and stamps to help you react the same way you might if you were gathered around a whiteboard with your team.
- Cleanliness. When you hold reviews in FigJam, you don’t have to worry about cluttering your primary design file with feedback, doodles, or edits. This way, you can keep Figma as your single source of truth for designs.
- Artifacts. FigJam can easily function as a centralized place for artifacts of the design process, from brainstorming and ideation through feedback and iteration. You can even embed your FigJam files in other documentation tools such as Coda, Notion, and Dropbox Paper.
Much like leading a brainstorming session, the success of a review process often hinges on its structure and format. As a result, the steps are quite similar:
Define your goals
Before you start putting pen to paper, it’s important to know what you want out of the session. Consider the goal of the review, the kind of feedback you want, and the audience you’ll be speaking to (eg. executives, designers, engineers, etc). These factors will all influence how you conduct the review session and the type of materials you will need. For example, if you want to do a review where your team generates new ideas based on their feedback, you might consider building in a whiteboarding space for each person.
Prepare the FigJam file
Next up, you’ll want to get your FigJam file organized and ready for review. You can bring the designs you want critiqued from Figma into FigJam by copying and pasting, and communicate the flow of your screens using FigJam’s connectors.
Using components can help standardize the format in which you collect your feedback and lower the barrier to entry for participants to submit feedback. This also has the added benefit of reducing the impulse for participants to get distracted by things like colors or font size. Alternatively, if you only want certain types of feedback on specific parts of the flow, you might create a custom feedback card component that participants can fill out.
To make a component for FigJam, simply build it in Figma, publish the library, and then add it into the components tab in FigJam. If you build components with auto layout in Figma, they will still resize responsively in FigJam. You can also switch between different variants in FigJam.
You can use a component to populate important background information (as pictured below) or use FigJam’s text and hyperlink features to add descriptions and link out to relevant documentation, prototypes, and design files.

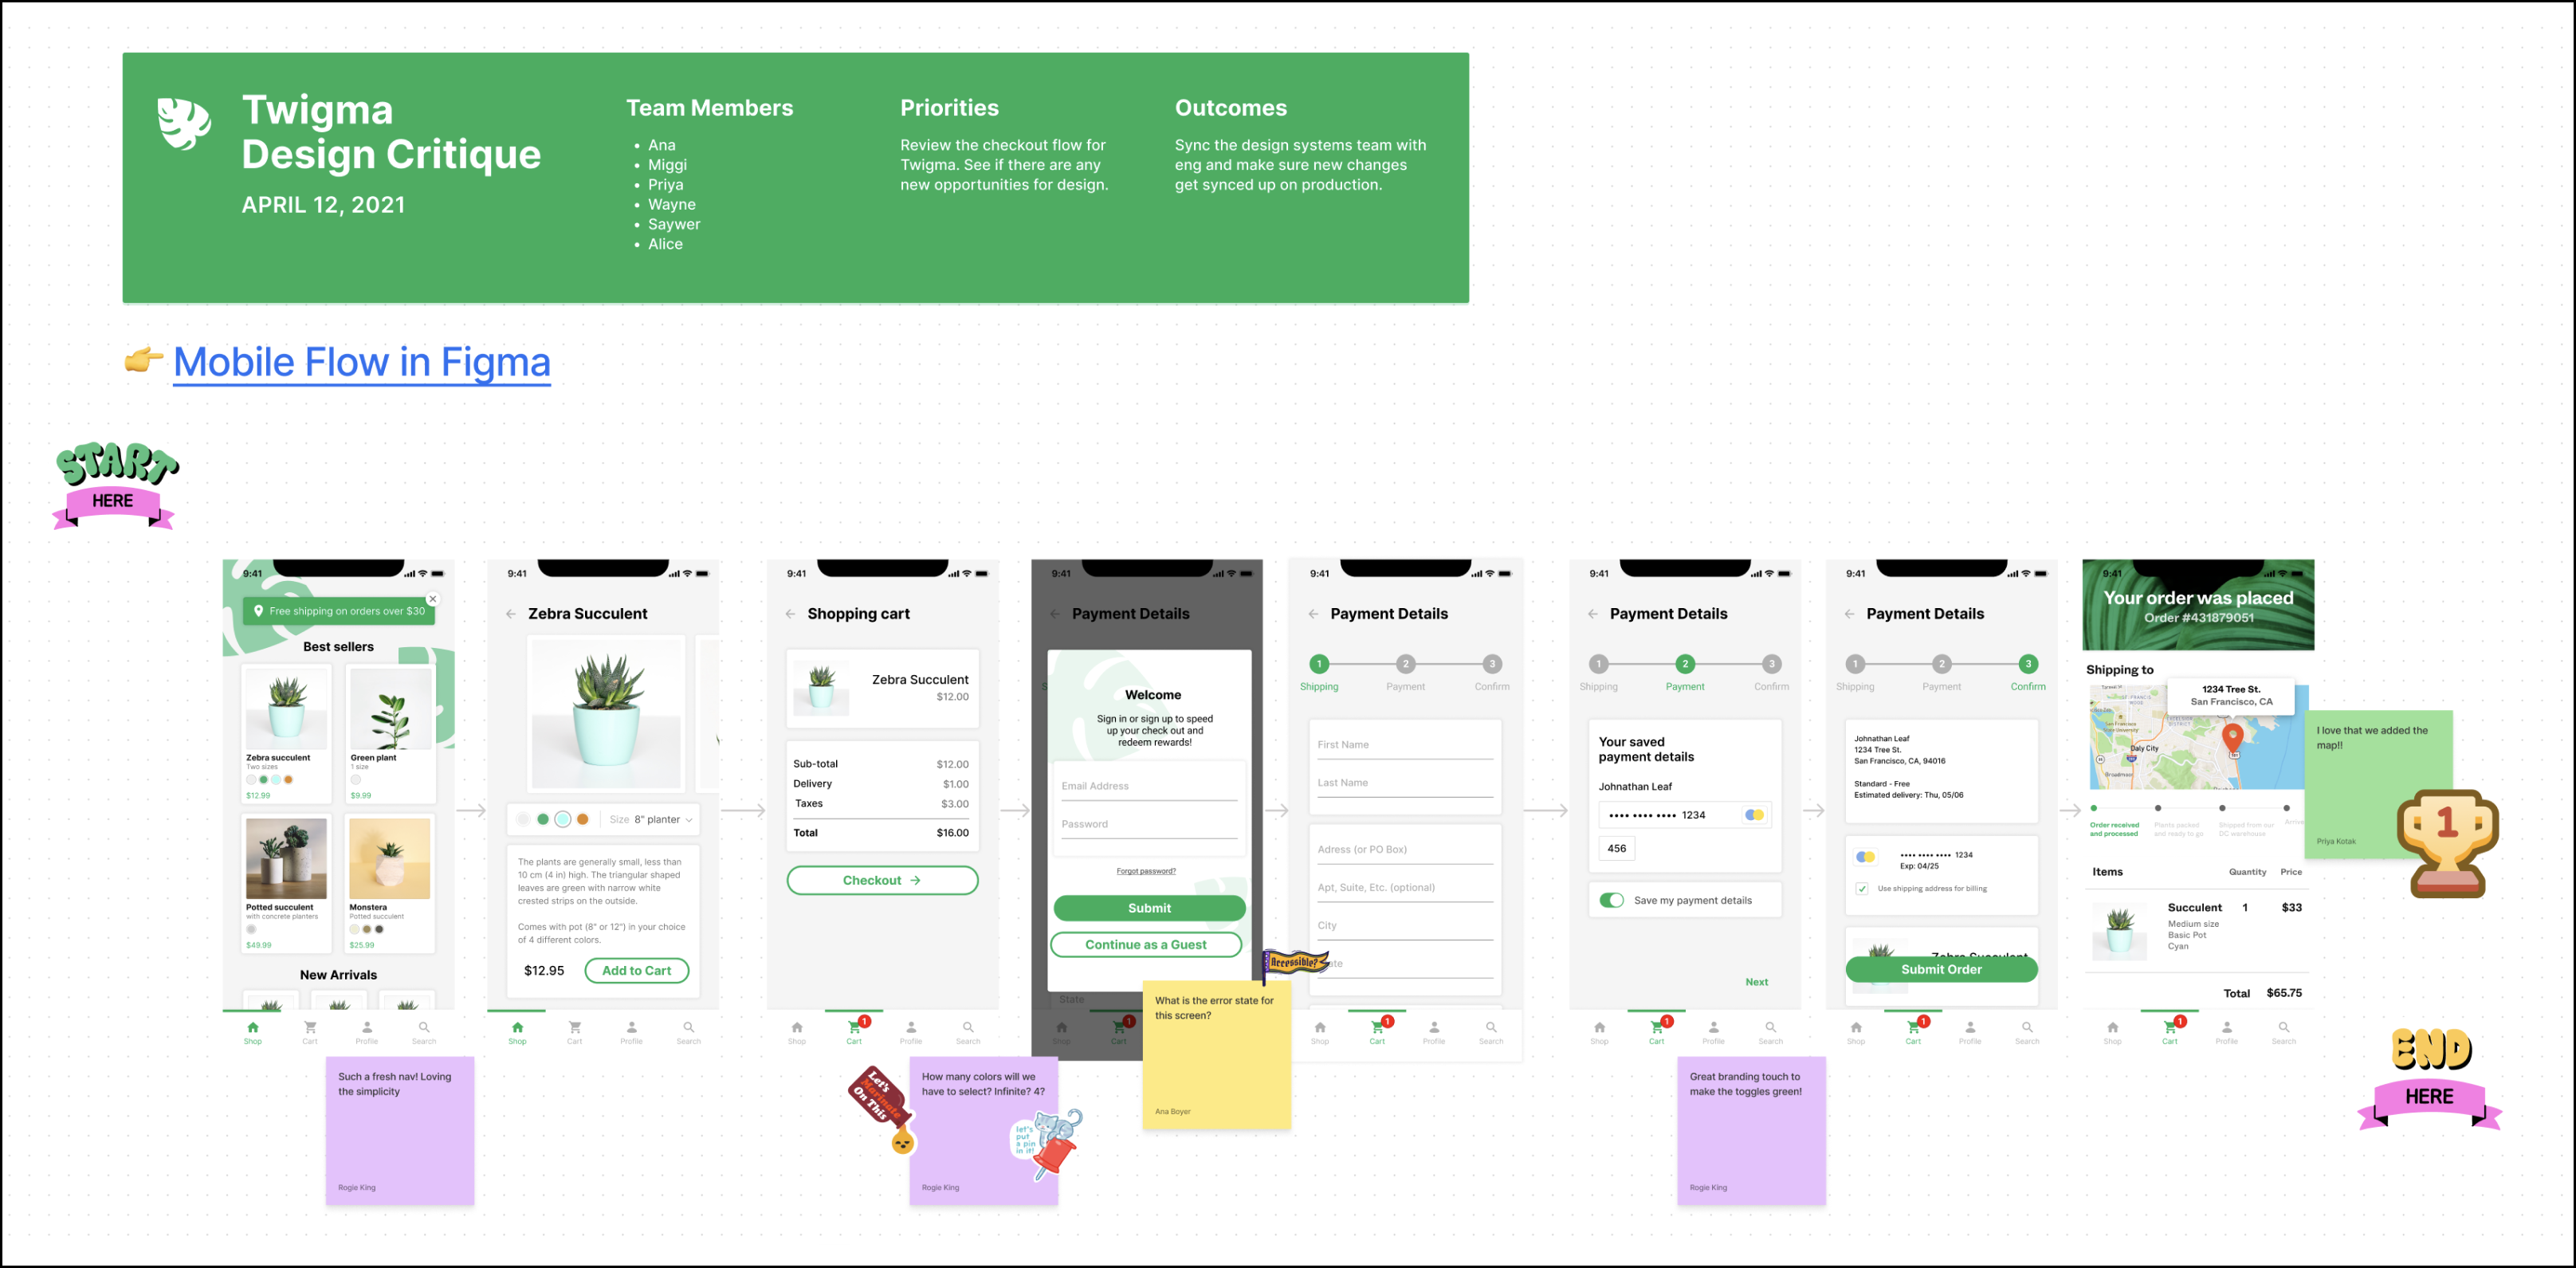
Facilitate the session
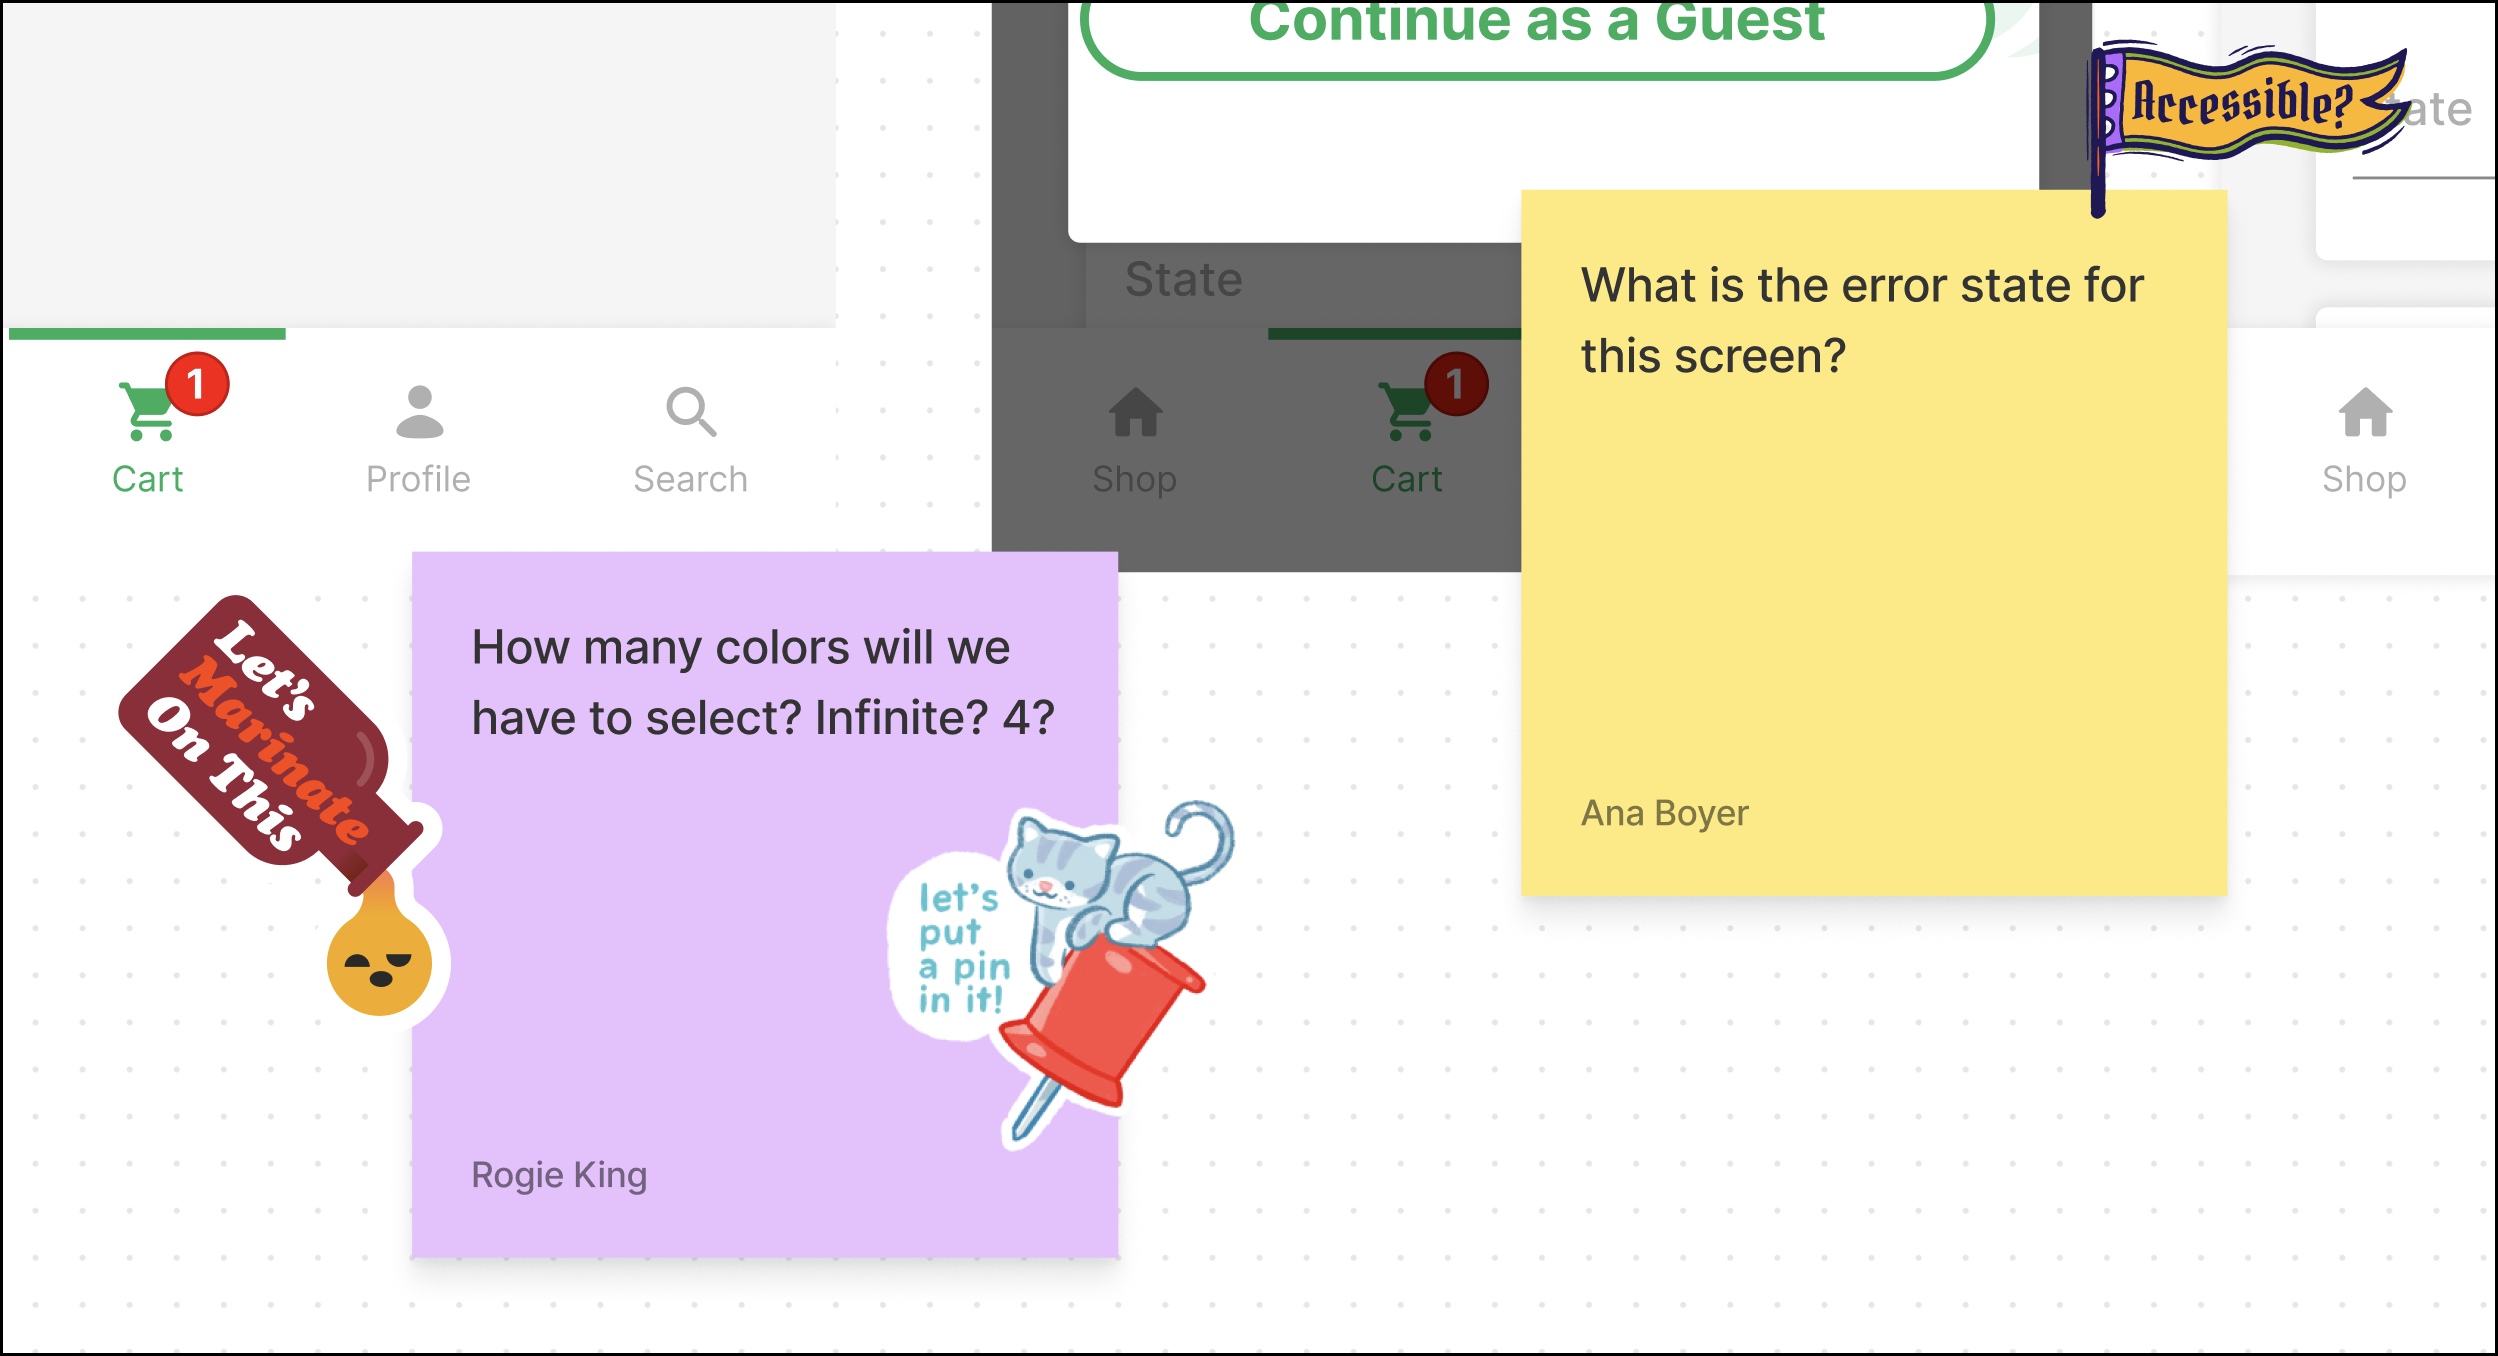
Once your feedback session is structured to your liking, it’s time to bring your team into the fold. As a facilitator, you can, again, use FigJam’s built-in timer, audio chat, and cursor chat, to communicate with your team seamlessly. Your participants can leave feedback in any way they want—doodles, stickies, text, stamps, and components are all in play. The pre-built stickers in FigJam can be particularly fun to use when providing feedback or highlighting certain aspects of the work.

Follow up
Before ending the session (or immediately following), it’s important to align on decisions and next steps. This way your team has a clear direction as you continue iterating on your designs in Figma.
Bringing it all together
Figma and FigJam work side by side to make collaboration seamless throughout the entire design process. With tools that keep ideas and conversations flowing, FigJam makes the brainstorming, diagramming, and feedback phases easy and fun. And, there are all kinds of use cases beyond the ones I shared here—teams have told us how they use FigJam for team bonding, user testing, sketching, games, and more.
Check out more templates to get started.