


Opening up the data behind your design systems


Design System Analytics enables you to see library usage trends, compare libraries, and drill into component usage.
Share Opening up the data behind your design systems
As of February 2025, Figma’s Library Analytics now includes styles and variables data in addition to the existing components data for both Organization and Enterprise customers, with expanded capabilities available through the Library Analytics API for Enterprise customers. Functionality in this article may not represent these changes.
As a browser-based tool built entirely in the cloud, Figma has the unique opportunity to provide visibility into how designers use the system. Today, we’re introducing Design System Analytics to make it easier for companies like Microsoft, Squarespace, or any Figma Organization customer to build and maintain their design systems with data.
Design System Analytics enables you to see library usage trends, compare libraries, and drill into component usage.
While building this feature, we worked closely with several customers to learn what they wanted out of analytics and what they didn’t. As a result, we focused on building analytics that illuminate how your design systems are used across your teams, without policing designers’ every move.
Here are some examples from our beta customers about what they’re learning from analytics and how they’re taking action on these insights.
Learn what’s working, and what’s not
With insights into library and component usage, design system managers can make ongoing improvements with quantitative feedback.
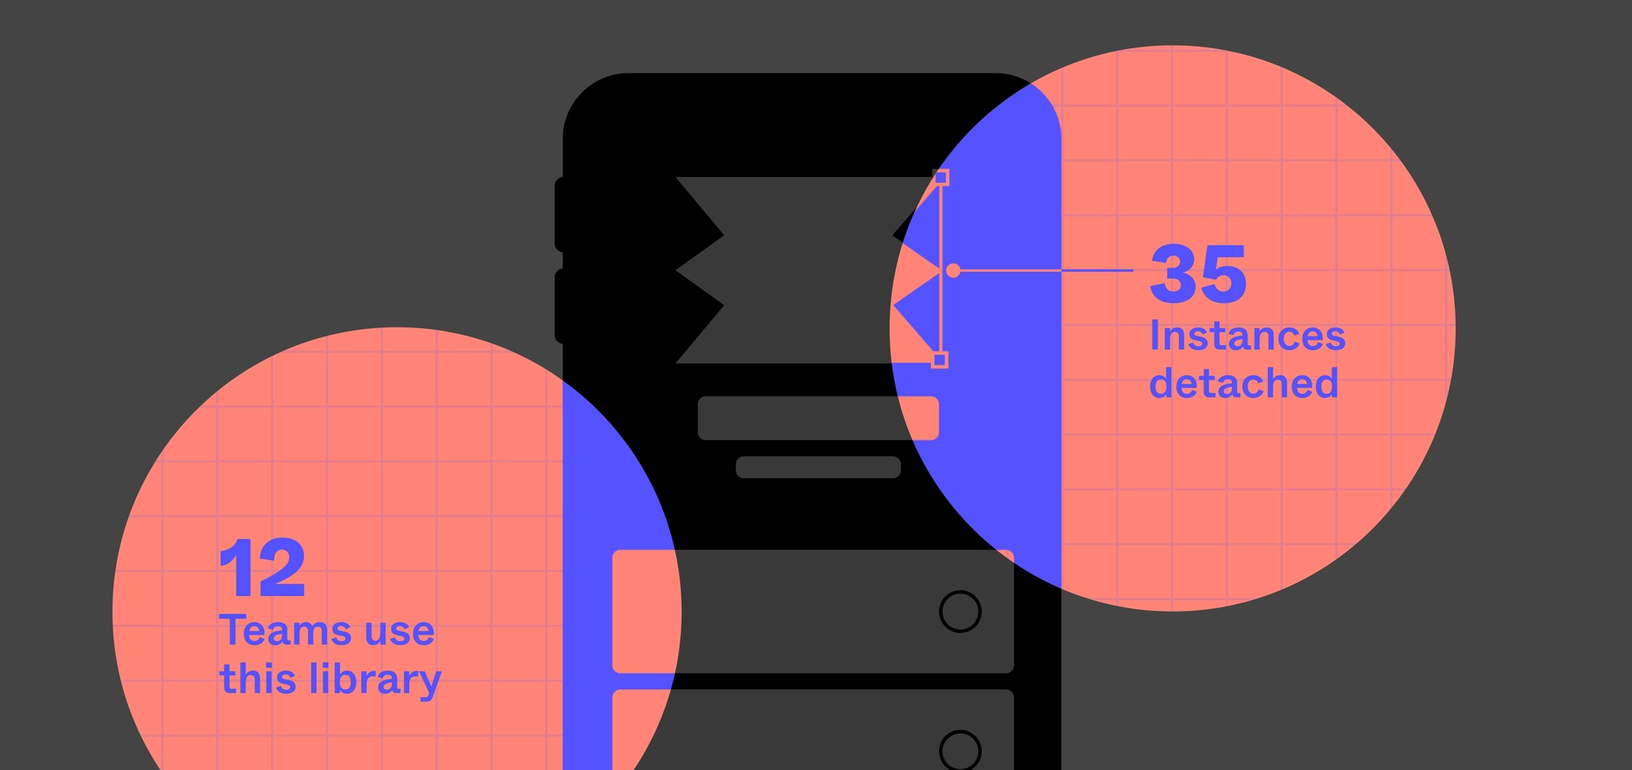
Microsoft’s Damien Aistrope, Principal Designer on the Fluent design system, explains, “There are so many teams at Microsoft using Fluent, and we don’t always get feedback from them about what’s working and what’s not. So it’s helpful for us to see which components aren’t being used and not important to maintain, as well as which components are often detached and may need updating.”
At Google, this type of data feedback is helping teams uncover new opportunities to evolve components on an ongoing basis. When reviewing the new analytics reports, Philippe Cao, a Senior Visual Designer on the Material Design Team, discovered that the button component was used and detached more than any other component. This helped him realize that the master component was overly complex and that he should create a simpler version in addition to it, giving designers on his team the flexibility they needed.
Understand how libraries are used
With the ability to compare the usage of two libraries over time, Design System Analytics can also help you keep a pulse on library adoption.
For example, the Design Platform Team at Squarespace is working on replacing an existing shared library with a new version that makes use of our upcoming Auto-Layout capabilities.
With Design System Analytics, they’ll be able to track adoption of the new library across teams as well as ensure deprecation of the old version.

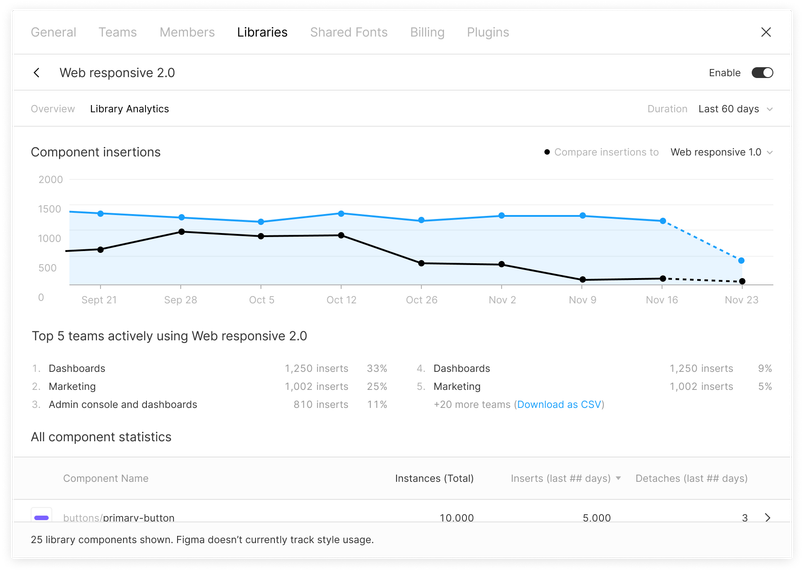
Going beyond just library usage trends, you can also dig into how individual components are being used. Designers at Pluralsight, an online education company, are excited to use Design System Analytics to surface how their teammates are using shared components from their design system. Because Figma allows for open collaboration and Design System Analytics are viewable by anyone at your organization, any designer or manager can quickly view reports they care about or find examples to learn from.
Measure the impact of design earlier
With analytics that enable you to look under the hood of your design system libraries, you can also measure design system adoption earlier in the product development process.
For example, the team at Bukalapak, one of the largest e-commerce companies in Indonesia, had previously measured design system adoption in the development phase, by analyzing component usage in their iOS and Android codebases. Now with Design System Analytics in Figma, the Bukalapak team has insight into library and component adoption much earlier, in the design phase, which gives them more confidence in what they ship to development.
We loved hearing what our customers are already doing with these new insights and can’t wait to learn more so we can continue to build upon this feature.
For more on what you can do with Design System Analytics, get in touch to learn more about the Figma Organization plan.