FigJam
Supercharge your schedule with the Gantt chart maker
With FigJam’s work plans, flow charts, and Gantt chart makers, craft a solid project schedule that carries your team across the finish line.

Gantt chart maker
Illustrate timelines and keep your projects up to par with our Gantt chart template.

Raise the bar for project management
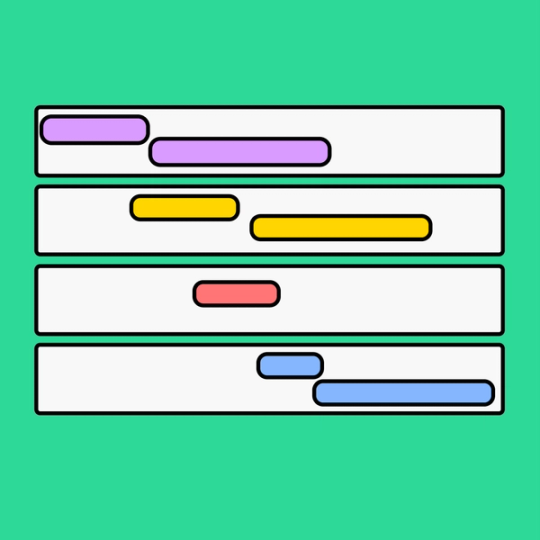
The Gantt chart generator makes task management easy. Easily map out resource use, project phases, and final deadlines to create a unified project plan. There’s a reason it’s an all-time favorite.
Raise the bar (chart): Keep everyone up-to-date and inspired with cursor chats, stamps, and polls that bring the whole team to the table.
See milestones by the minute: Scope out exactly what’s on the horizon with tasks, deadlines, and events set against a clear timetable.
Set a course for success: Provide your team with a clear project timeline and fold in feedback, ideas, and adjustments.


FigJam
A classic, made collaborative
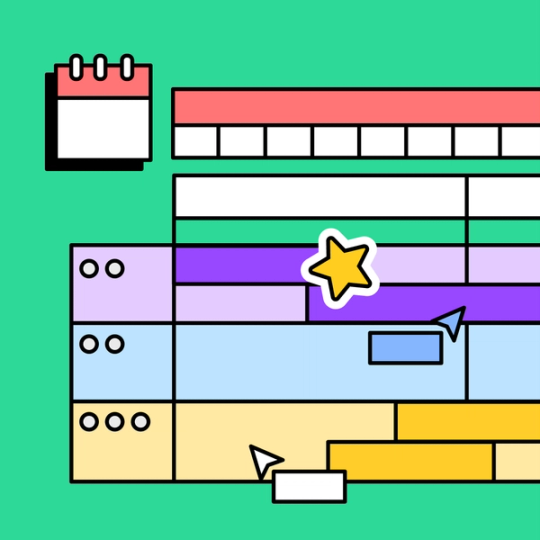
Cultivate team collaboration with a scheduling template that invites your team to jam out ideas. Collaborate on an interactive whiteboard, easily assign tasks, and bring your Gantt chart into the future with community-built widgets.
Build a project schedule worth sticking to
Ensure proper task management and stay on schedule with the Gantt chart template. Hit your milestones? Explore related templates from our Community.


FAQs
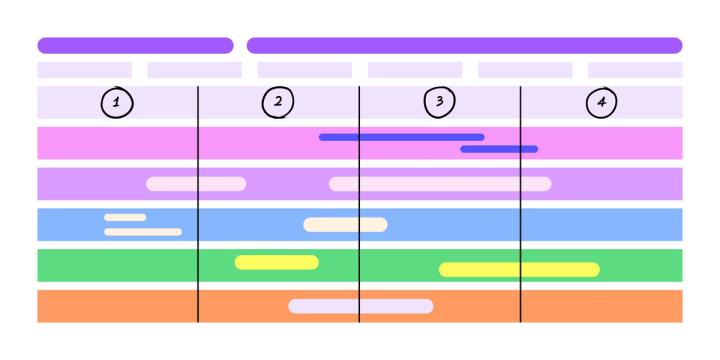
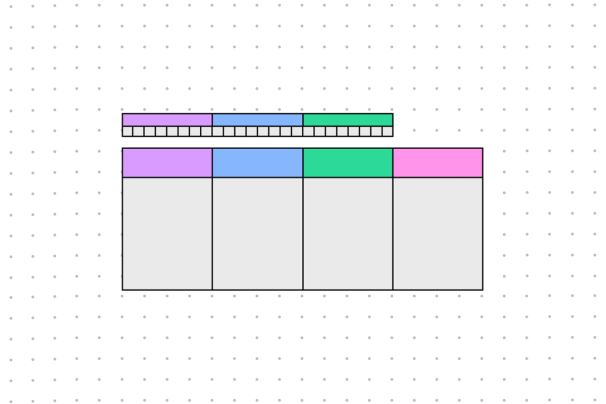
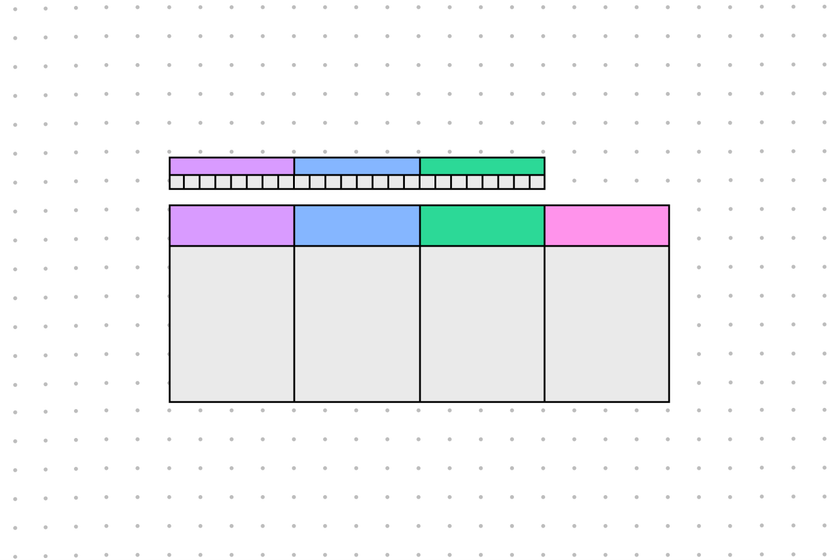
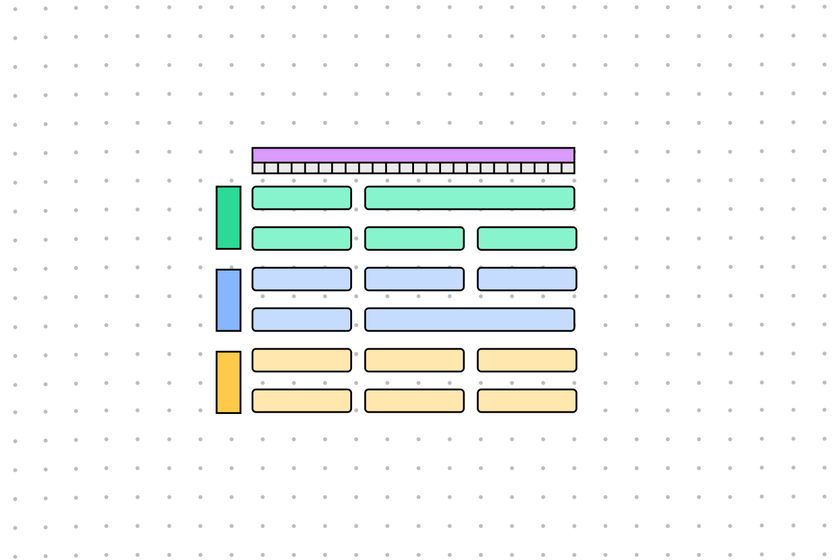
The Gantt chart is a type of bar chart used for project planning that typically lists tasks and responsibilities on its vertical axis and time intervals on its horizontal axis. The chart stretches from the start date of a project to its completion, with horizontal bars that correspond with each task and activity and its duration.
So what is a Gantt chart used for, and why is it important? Gantt charts are popular project management tools for a reason. Teams use these schedules to gain a birds’ eye view of the project progress. With a zoomed-out perspective, they can track when they’ll need to devote time and resources to certain milestones or events.
To make a Gantt chart, list your project tasks along the left side of your chart, moving from the top of the chart downward making it easy to visualize any task dependency. Then list time intervals as specific dates (June 1, July 1, August 1) or as week numbers (Week 1, Week 2, Week 3) across the top of your chart.
Place horizontal bars within the chart to display the start and end dates for each task. Once you’ve assigned a time interval for each task, you’ll have a framework for when your tasks will begin and when they should be completed. To make things pop, give each bar a different color.
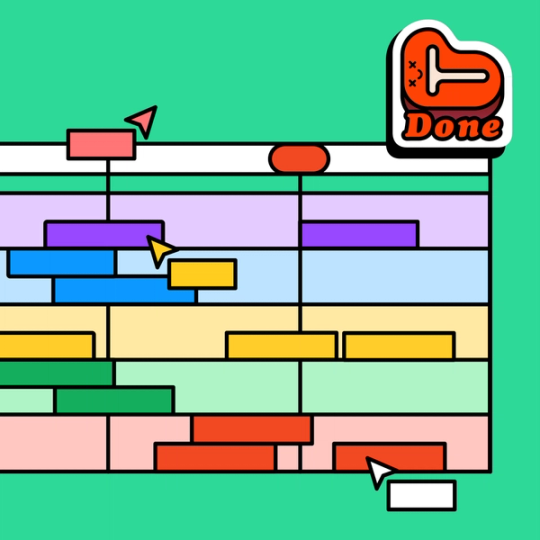
As you assign tasks to different team members, make sure to highlight key milestones for important dates of the project, and plan accordingly for any dependencies. Track your team’s progress regularly and update the timeline with any changes.
Need some help bringing your schedule into high definition? Use our free Gantt chart example and easily customize it to set a high bar for your next project.
To read a Gantt chart, begin by examining the subjects along the left axis. These represent the different aspects or tasks associated with the project. Next, take a look at the timeline represented on the x-axis of the chart. Once you get a sense of these axes, you’ll have to look at any bar placed on the chart to understand what it is and when it should be completed.
Some Gantt charts will also list assigned task owners, descriptions for the task, and any dependency notes to keep in mind for project planning.
Our online Gantt chart maker is an easy way to build Gantt charts and manage project timelines. Choose a start and end date to kickstart the project planning process. If you're juggling multiple projects at once, consider using separate Gantt charts for each initiative.
Once you've mapped out the target start and end date, divide that timeline into distinct phases. From there, categorize key tasks, itemize subtasks, and list any dependencies. Ensure every project task has a due date and owner, and review your project timeline regularly to stay on track.
Other templates you might like


Explore 1,000+ templates on the Figma community
Explore even more templates, widgets, and plugins—all built by the Figma community.

