FigJam
Go with the flow—and make the flow go—using a PERT chart example
Use the Project Evaluation Review Technique to lay out your project’s trajectory. Uncover a clear visual directive that takes your team across the finish line with ease.

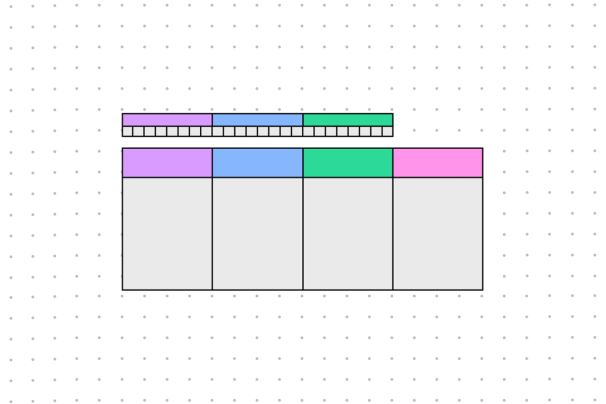
PERT chart template
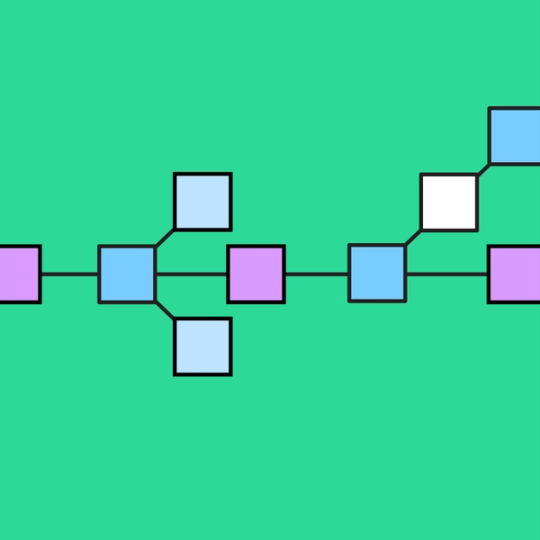
Organize tasks and understand their interdependencies with this step-by-step diagram that schedules out your milestones.
Can’t spell “perfect,” “pretty” or “project” without PERT
Untangle snags, eliminate bottlenecks, and align schedules for a visual plan so perfectly clear that it might just make you blush.
Contour: Sculpt the overall shape of your project based on necessary tasks and their interdependencies.
Highlight: Bring every critical task to the forefront with a graphical representation.
Polish: Confidently organize each part of the process for knock-out results.


FigJam
A makeover for the whole office
Give your project management process a facelift with FigJam. Invite the team to test out your project schedule, add colorful widgets like Calendar and Lil Notes, and show off newfound skills using FigJam’s palette of resources as your foundation.
Unlock PERTinent templates
Outline a successful project timeline with a PERT chart. Complete and check off each task along the way using free resources from FigJam’s Community.


FAQs
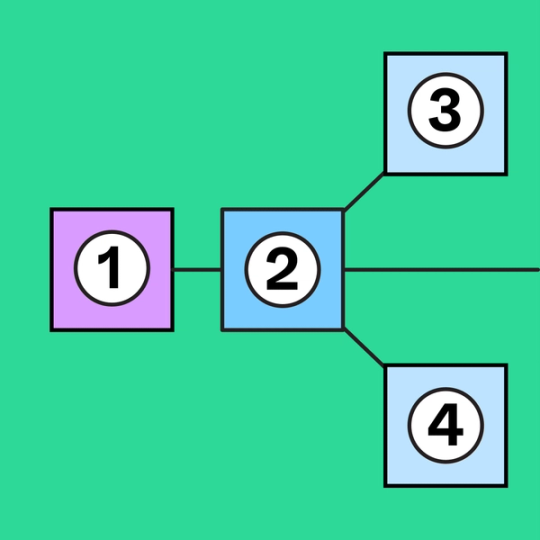
PERT diagrams, or Project Evaluation Review Technique charts, are a visual representation of a project’s interdependent tasks along the predetermined project timeline. A simple PERT chart breaks projects into individual tasks with connective lines to show the order and relationship between steps. Each nodule in a PERT diagram maker shows the start date and the expected time of its represented task, with nodules arranged in sequential order.
Project managers use this visual tool as an overview of the team’s tasks and schedule. FigJam’s PERT chart template incorporates both the timeline and individual steps of your project into a shareable image that’s comprehensive and easy to follow. Get to know your project’s flow and adhere to deadlines with this diagram to guide the whole team.
You can find FigJam’s PERT chart online and start using it immediately. To begin, bring the team together to build out your PERT template following these steps:
1. Discuss and establish project milestones and tasks.
2. Note the dependencies between different tasks or goals.
3. Plug individual tasks and schedules into FigJam’s PERT chart generator.
4. Come to a consensus on a project timeline based on your diagram.
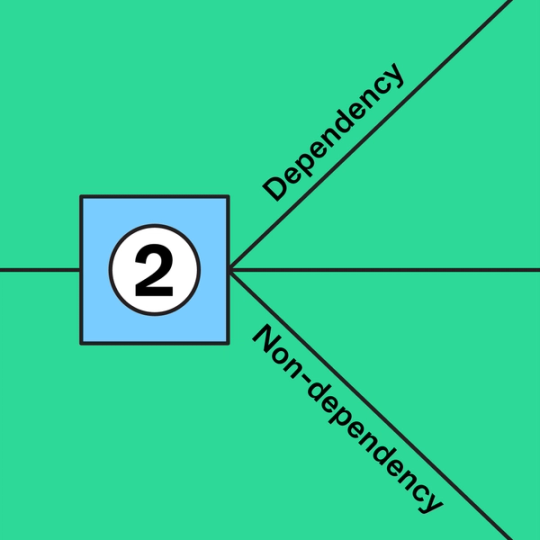
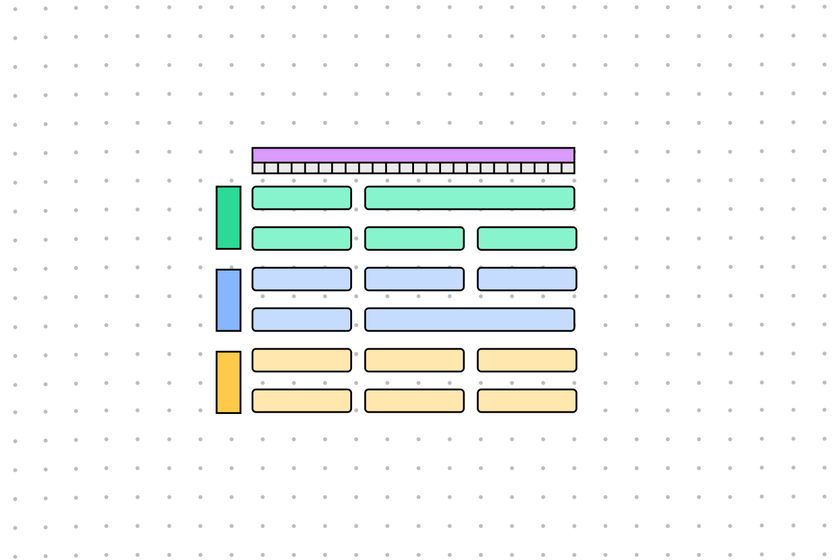
Both PERT and Gantt charts are useful project management tools that feature individual tasks along their timeline. A Gantt chart has individual tasks on the y-axis and time on the x-axis, with horizontal bars depicting the expected time for each task; alternatively, a PERT diagram example allows for a more freeform, adjustable project flow along the timeline and has dependent and non-dependent tasks branching out from central tasks.
Compared to a Gantt chart, this extra insight affords project managers the chance to predict bottlenecks and understand the importance of completing each task by its stated deadline.
Other templates you might like


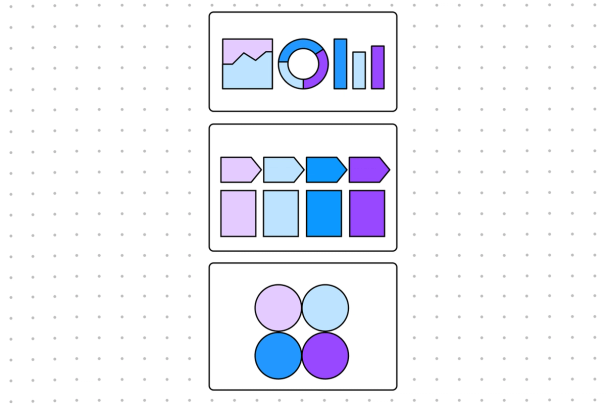


Explore 1,000+ templates on the Figma community
Explore even more templates, widgets, and plugins—all built by the Figma community.

