FigJam
Conquer your differences with a compare and contrast template
Contemplate the connections between concepts with a compare and contrast chart, a Venn diagram, a T chart, or your own invention—it’s all possible with FigJam.

Compare and contrast template
Cross-examine two topics with any number of people using a shareable compare and contrast chart.

Find joy in juxtaposition
Whether you’re in the classroom or the boardroom, a compare and contrast chart template can shed light on two distinct topics.
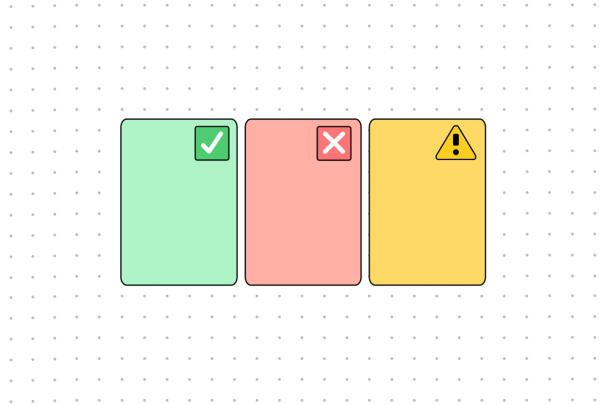
Discover differences: Identify instances where characters, stories, or themes are poles apart.
Study the similarities: Find out where seemingly unrelated concepts overlap.
See both sides: Create a balanced, unbiased overview of two opposing ideas.


FigJam
Work hand-in-hand, see things side-by-side
Contrasting two topics is better with two (or more) people. With a shared FigJam whiteboard, collaborating with classmates or colleagues is a piece of cake. Encourage participation through polls and votes, draw directly onto your diagram, and type or talk to each other wherever you are with help from Lil notes.
Weigh variables your way
Discover differences and similarities in any situation on our compare and contrast outline template. For different diagrams and similar schematics, try more templates from the Community.


FAQs
The compare and contrast chart is a graphic organizer with two separate sections for differences and a common middle area for similarities. The purpose of a compare and contrast chart is fairly straightforward. By placing two concepts next to each other, you can start to understand what connects them—and what sets them apart.
To create your compare and contrast chart, all you have to do is draw out a table or graphic with three sections:
- A space for Topic A’s features
- A space for Topic B’s features
- A space for the features that Topic A and Topic B share
For maximum flexibility—and maximum fun—start with a compare and contrast diagram template from FigJam. Move ideas around as they emerge, seamlessly integrate designs from Figma, and use emotes and stamps to add a dash of personality. It’s always easy to collaborate—no matter how different or similar your team members are.
As you might have guessed, creating a vertical timeline starts by drawing a vertical line. But before you draw your line, you should think about the narrative you want to explore. What story do you want your timeline to tell?
From there, you’ll write out a list of defining events, including the date or year of occurrence. Once you have every event and key moment, all that’s left is to arrange them in chronological order and add any necessary detail needed (especially if you’re creating an external document).
Creating a picture-perfect vertical timeline is a breeze with FigJam. Drag and drop shapes to easily rearrange events, pull in branded content from other documents, and crowdsource memories through polls, prompts, and comments—all without leaving your browser.
Other templates you might like


Explore 1,000+ templates on the Figma community
Explore even more templates, widgets, and plugins—all built by the Figma community.

