FigJam
Keep your agile team ahead of the curve with the Fibonacci estimation example
Whether you’re plotting a product launch or a launching into a project, FigJam’s templates help you prioritize responsibilities so you can get a relative estimation and can cross off task after task.


Fibonacci scale agile example
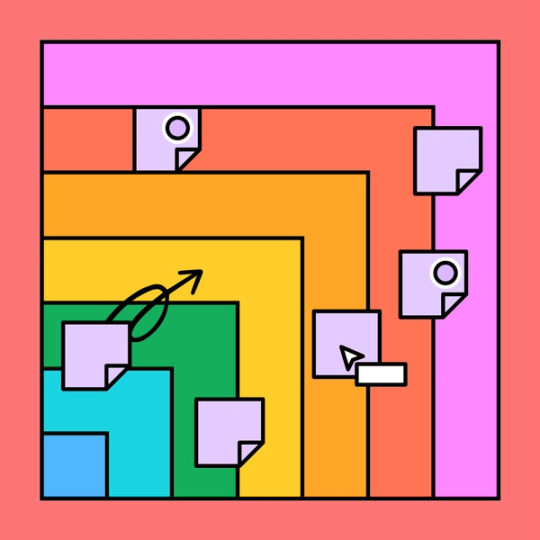
Collaborate with your cross-functional team to organize tasks by risk and effort.
Upward spirals only
Map out the contours of your project and clarify priorities to create a virtuous cycle of trust and commitment.
Encourage team bonding: Invite your development team to plot out and create an accurate estimate of upcoming tasks, take on responsibilities in real-time, and share their perspectives on the page.
Establish points of comparison: Create a shared understanding of how tasks in a process compare for a clearer picture of the overall effort required.
Estimate with precision: Account for project complexities before you get started with accurate estimates of effort and risk for both larger and smaller tasks.


FigJam
Teamwork is golden
With our Fibonacci scale template, it’s easy to circle back for more planning. Jot down and edit ideas with Lil Notes, compliment team members’ ideas with stamps and emotes, and clearly explain complex ideas with our cursor chat feature. Whether you’re ranking tasks for the first time or reorganizing steps based on shifting priorities, FigJam templates bring the whole group together.
Increase productivity exponentially
Get major points when you prioritize with our Fibonacci scale template. Then, see your vision through with more templates from our Community.


FAQs
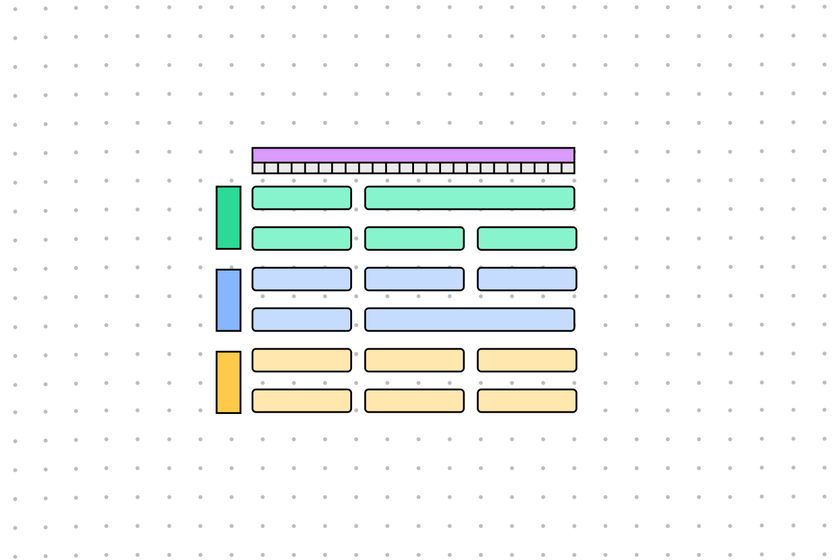
A Fibonacci scale comprises an exponential series of numbers, in which each number in the series is the sum of the previous two numbers, for example: 0, 1, 1, 2, 3, 5, 8, 13, 21. In business and software applications, Fibonacci scales can be used by project managers, agile teams or any team memberto estimate how long a given task might take.
Project managers commonly use the Fibonacci sequence in agile environments. Because the Fibonacci sequence increases exponentially, it’s helpful for calculating a complex task—which frequently progresses in a non-linear fashion.
In business models that prioritize individual interactions and evolving preferences over fixed plans and contracts, an agile Fibonacci sequence is the perfect tool for documenting key points as well as creating an estimation process based on the effort required to see each step through. An agile Fibonacci scale example organizes these newly occurring tasks by effort and risk to establish a clear resolution process and accurate estimation of the timeline at play.
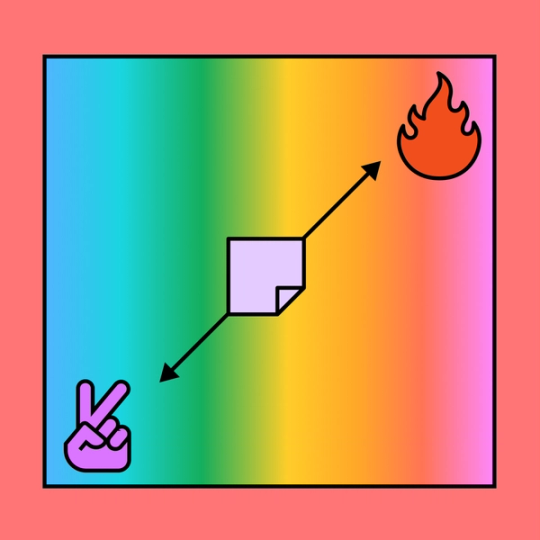
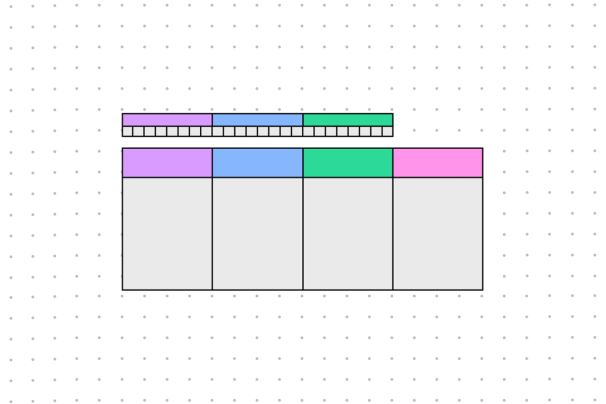
Fibonacci agile estimation method starts with a list of tasks to plot. Gather your team and discuss the various steps in your next project. Then, label the y-axis on your Fibonacci scale template with “risk” and the x-axis with “effort.” Each axis also contains Fibonacci numbers up to 21. Plot out the minimal tasks beginning at a risk and effort level of one and expand outward to medium and complex tasks. Once you’ve plotted your list of tasks, you’ll have a visual representation of the work to complete.
To reduce the effort and the risk that comes with diagramming, get started with FigJam’s free, customizable Fibonacci scale example.
Other templates you might like


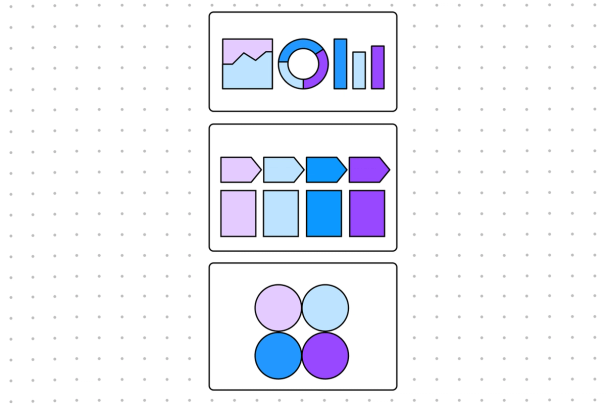


Explore 1,000+ templates on the Figma community
Explore even more templates, widgets, and plugins—all built by the Figma community.

