FigJam
Reach peak performance with our KPI dashboard template
Whether you’re hitting the ground running on a new venture or revving up organizational growth, stretch your potential and rise to the top with FigJam KPI dashboard templates.

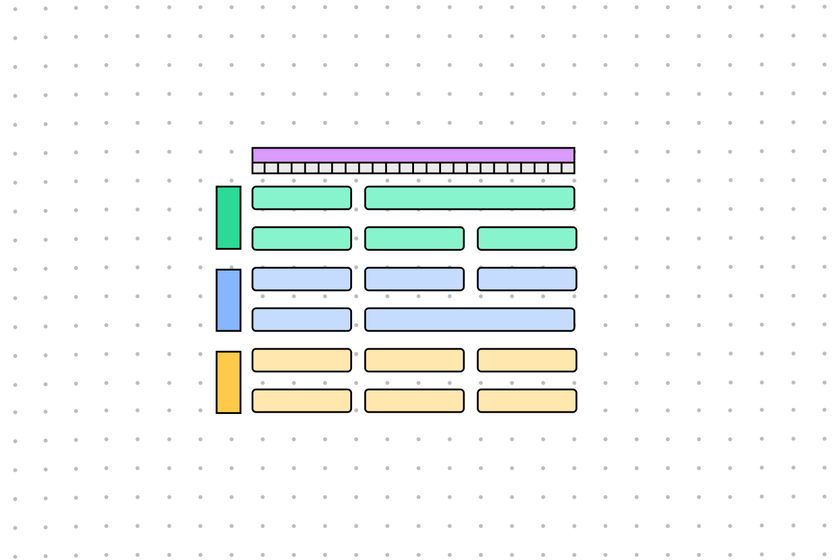
KPI dashboard template
Visualize team metrics and hit your key performance indicators together on our free interactive template.
Blaze a new (data-driven) trail
Follow the data and find the next steps on a dashboard that highlights simple key performance indicator metrics.
Share the data: Share easy-to-understand metrics with team members to boost morale and celebrate progress.
Take action together: Use the KPI chart as a guiding framework that reveals the group's next action steps.
Make informed decisions: Distill large volumes of data into simple, powerful metrics to make evidence-based decisions.


FigJam
Free, but not solo
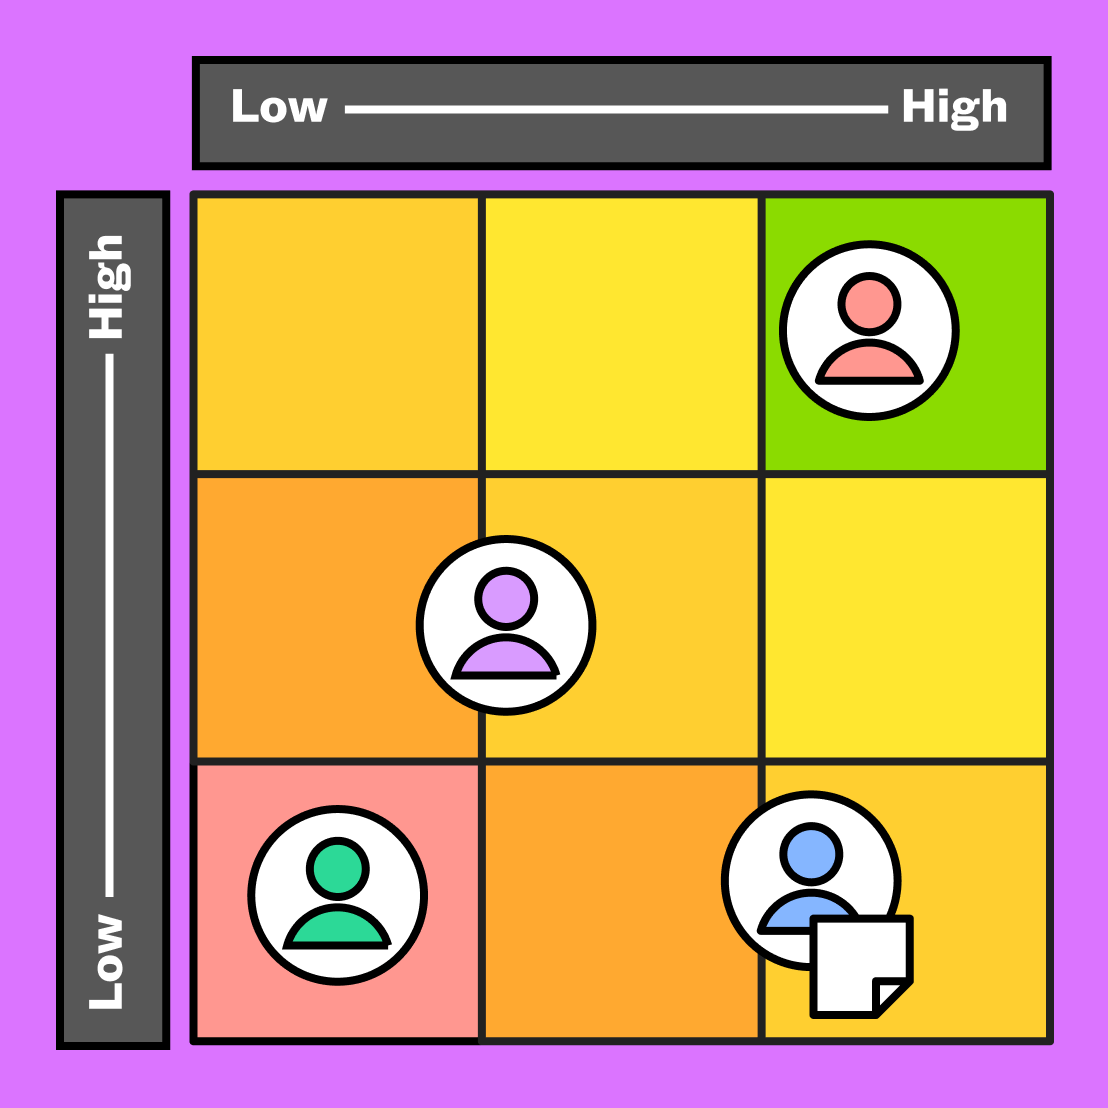
Take performance to the top by planning and building as a team in one free collaboration zone. Share feedback and figures to determine meaningful milestones, contextualize your metrics with Lil’ Notes and Anonymous Thoughts, and integrate up-to-date data and designs from Figma. Climb up together with FigJam templates.
Meet at base camp, ascend to new heights
Establish shared KPIs to measure company performance. Then, create a culture of growth and collaboration from the ground up—and a little support from Community templates.


FAQs
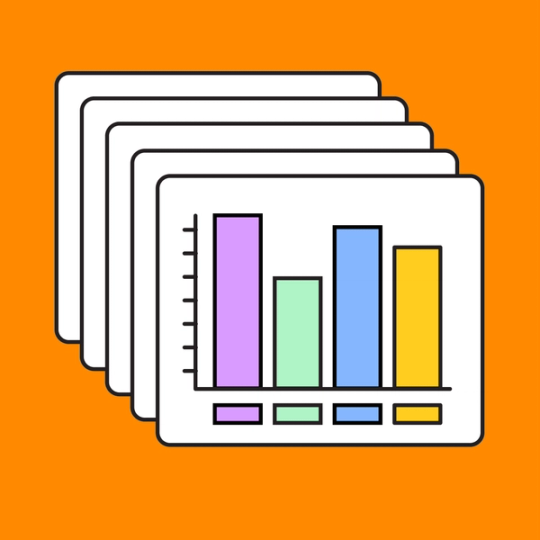
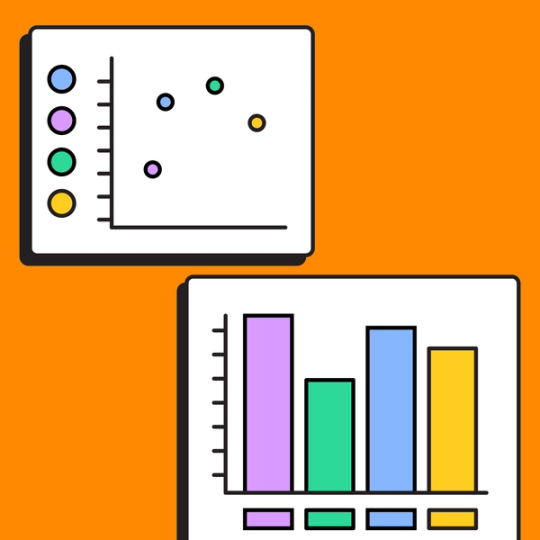
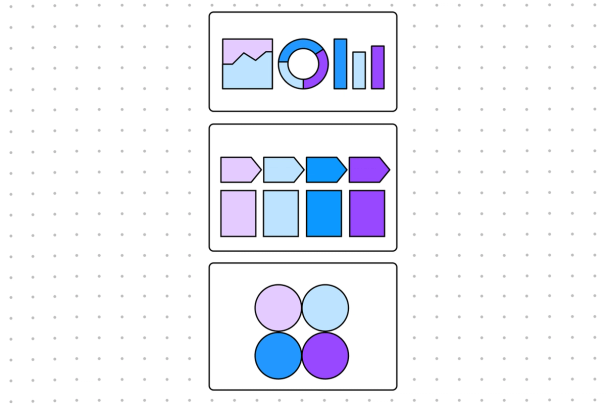
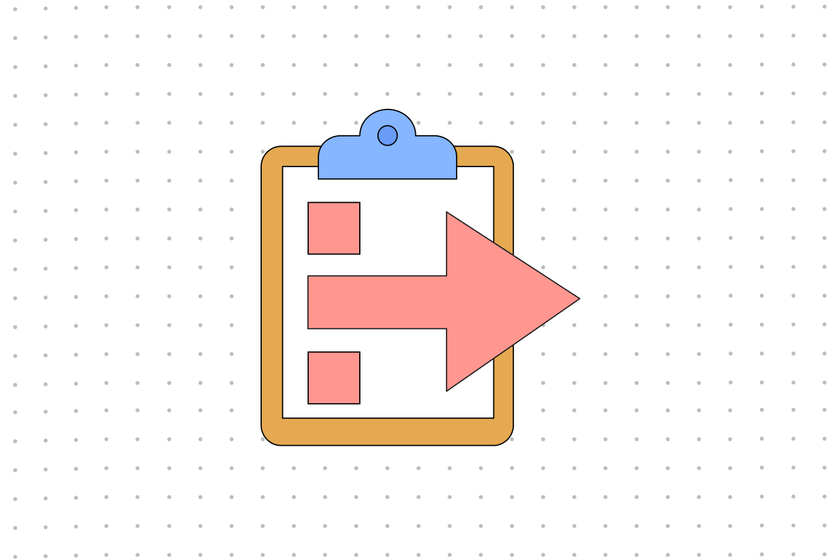
A KPI chart displays your team’s key performance indicators—high-level metrics you’ve chosen to measure success—to set expectations and assess project results. By tracking key performance indicators (KPIs) and current metrics in a clear visualization, you can quickly gain insight into growth potential, company performance, and actionable next steps.
To create a KPI dashboard, begin with our KPI chart template. Then, jot down a list of possible KPIs to measure your success—metrics that indicate a job well done, like the number of leads or hires or revenue and sales growth. Feel free to gather your team to discuss which metrics best capture company performance.
Once you’ve determined which metrics you’ll include, you’ll also work collectively to determine the standard you’ll strive to meet. Be sure to consider:
- Industry averages to understand what is standard in your field
- Competitor performance to have a picture of your relative performance
- Your past results to evaluate room for improvement
Finally, set aside a regular time to review your KPI dashboard. Whether you choose to evaluate KPIs on a monthly, quarterly, or yearly basis, creating a consistent routine is important. So is returning to the KPI dashboard as you design new projects.
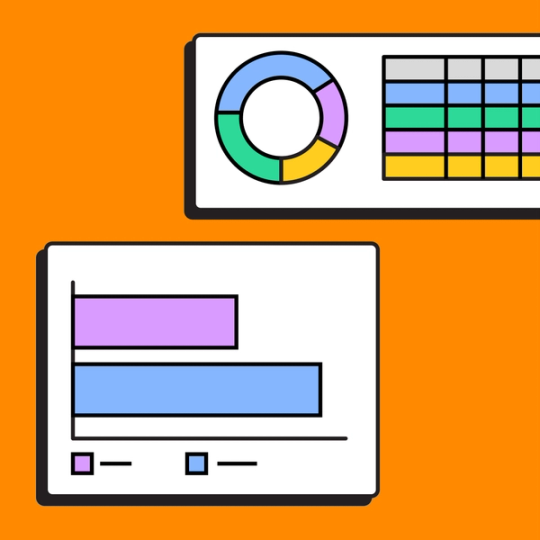
KPI dashboard examples typically include a variety of metrics. Although your metrics will be unique to your business, consider the following categories of KPIs to get the ball rolling:
- Quantitative metrics – Lean on these numbers-based metrics to objectively measure project success. Examples include profit levels, the number of customer conversions, investment returns, and more.
- Qualitative metrics – Business projects are often complex, and a single number may not be able to adequately represent success or failure. While most of your KPIs should be straightforward and objective, turn to these subjective measures to round out your metrics. Qualitative metrics root in emotions and experiences; an example might be a positive user comment.
Other templates you might like


Explore 1,000+ templates on the Figma community
Explore even more templates, widgets, and plugins—all built by the Figma community.

