FigJam
See how stakeholders stack up with a stakeholder onion diagram
Whether you’re kicking off a new project or mapping out milestones, understanding your stakeholders can impact your success. FigJam’s stakeholder onion diagram template helps you see where everyone stands before you start up.

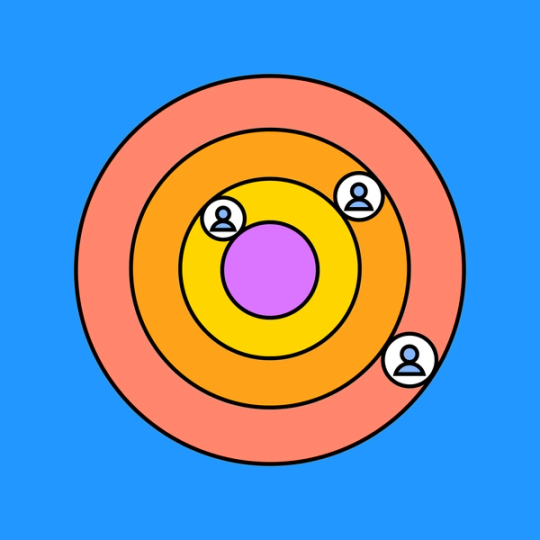
Stakeholder onion diagram
Organize your stakeholders by rungs of influence on FigJam’s collaborative template.
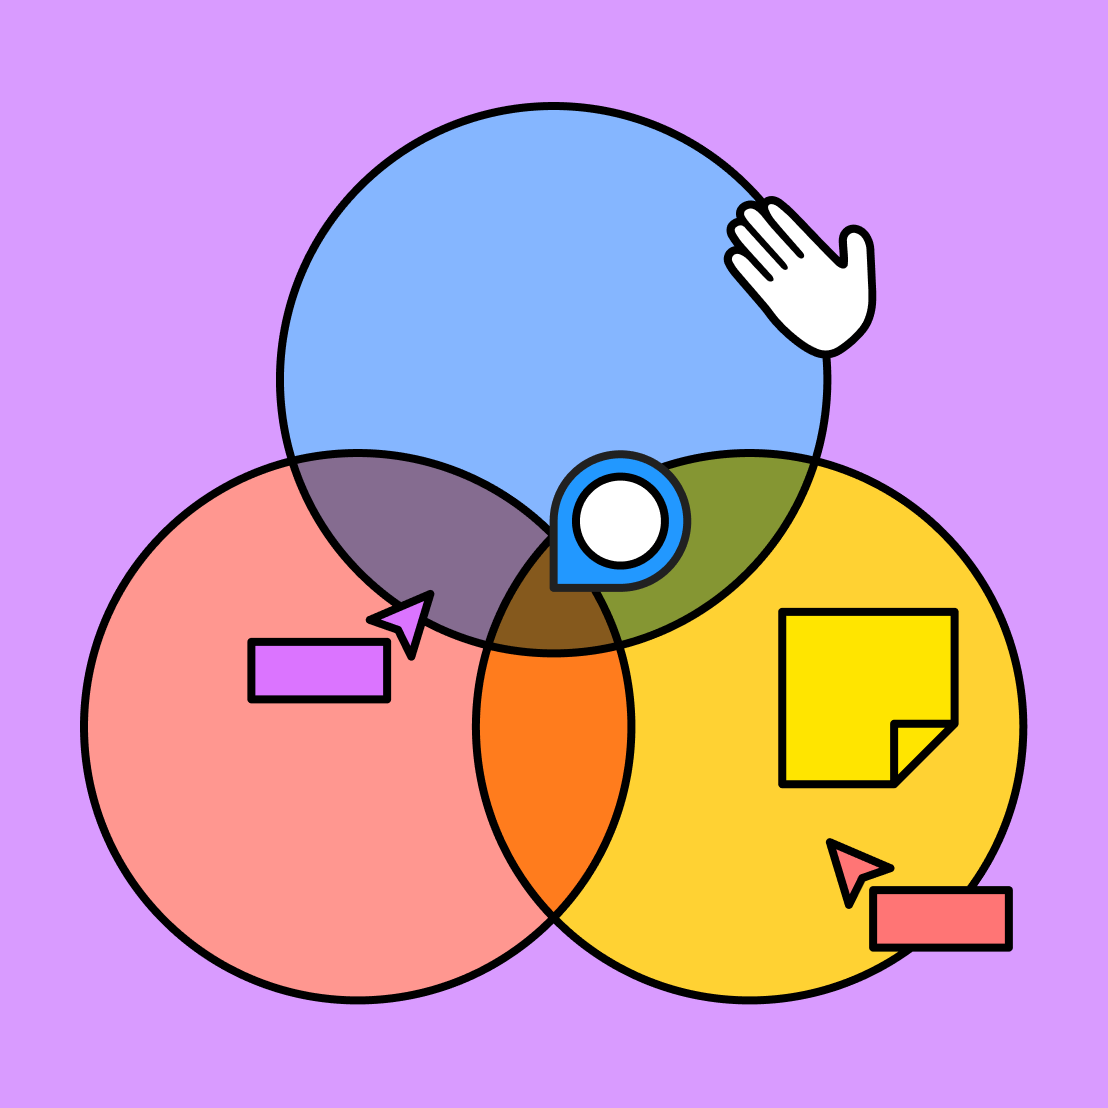
Peel back the layers
Make sense of your stakeholders’ varying levels of interest and influence on an intuitive onion chart.
Identify: From investors to target users,pin down exactly who your stakeholders are to determine what they need.
Relate: Understand how your stakeholders interact with one another to build bridges between departments and disciplines.
Stratify: Categorize the level of direct influence your stakeholders have over your organization or product, top to bottom.


FigJam
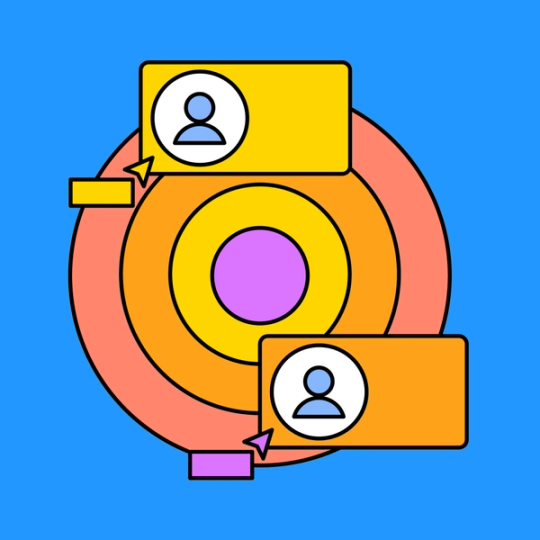
Slice and dice with built-in tools
FigJam’s digital design tools give every person on your team diagramming superpowers. Streamline and simplify your project planning process with the help of integrated widgets like Badge and Teams. With a collaborative template, you can bring your stakeholders onto the diagram and onto the drawing board.
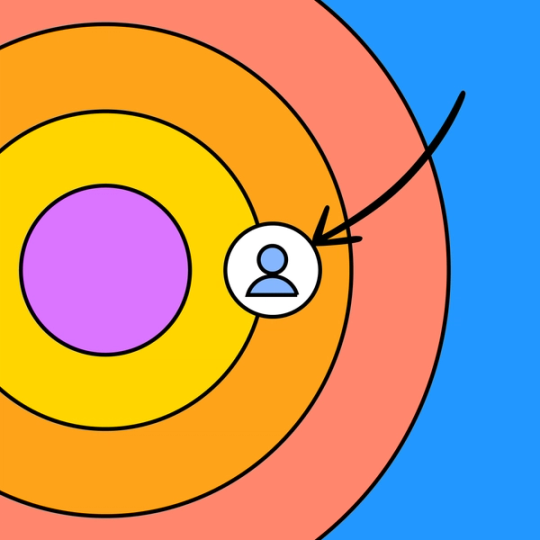
Get specific, see results
The closer you look at your stakeholders, the more support you’ll find. FigJam diagram templates make zooming in easier than ever.


FAQs
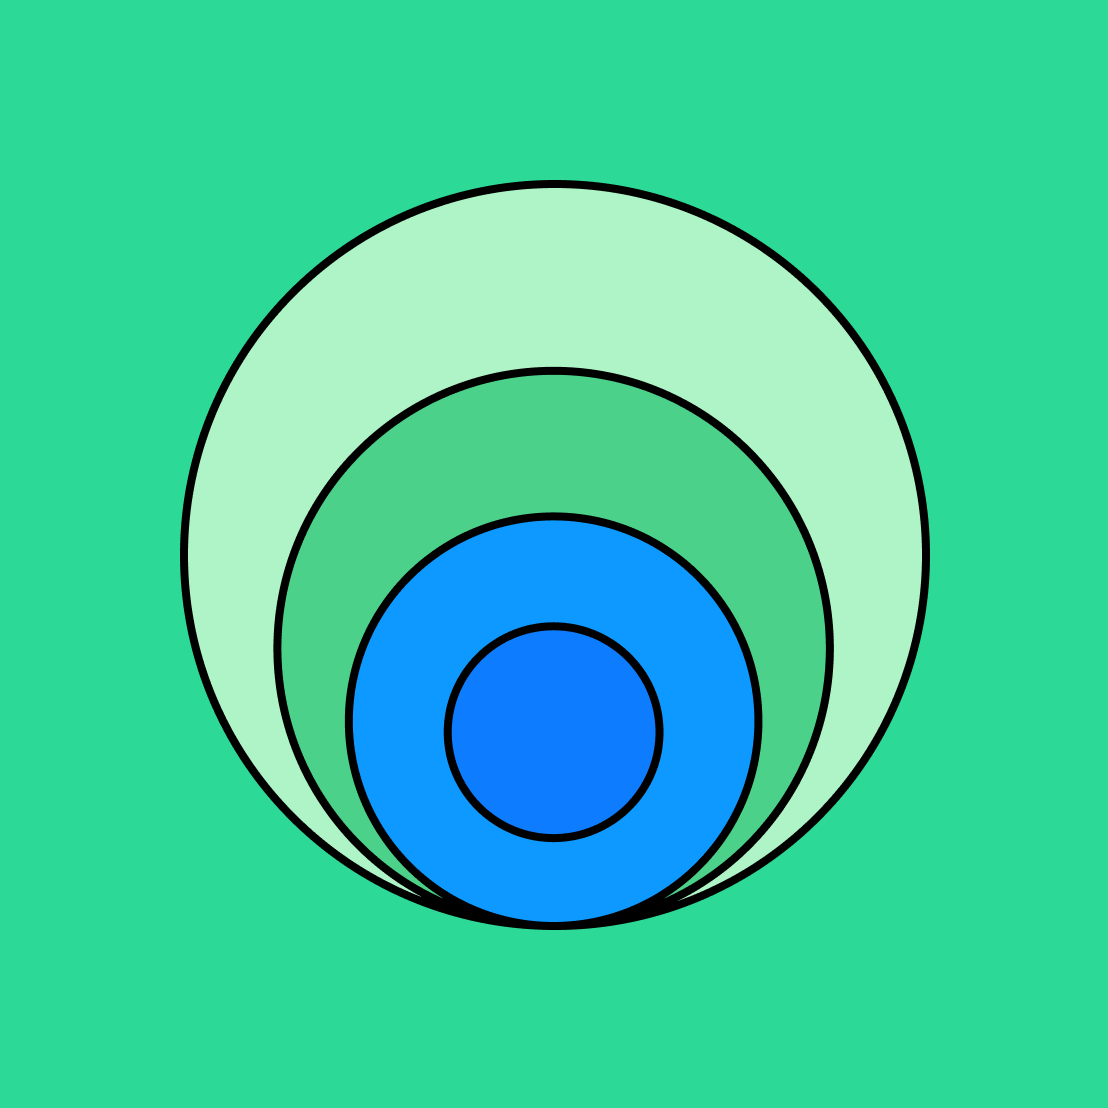
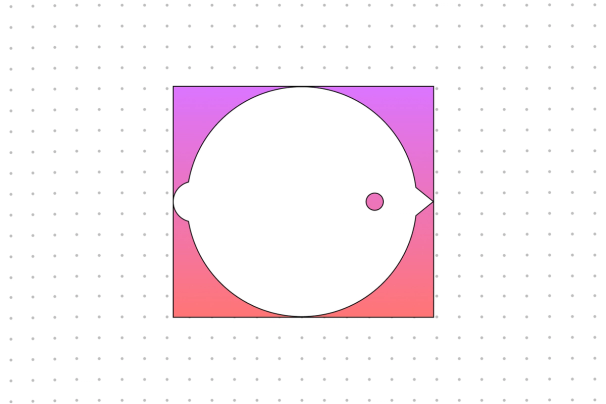
An onion diagram is an analytical tool that helps organizations determine who their stakeholders are and how each stakeholder role interacts with the organization. It is formatted with a core process or product at the center, surrounded by layers of stakeholders. The stakeholders who have the most direct influence over the core process or product sit in the first layer, with the level of influence decreasing in each subsequent layer.
The most efficient way to make an onion diagram is to use FigJam’s stakeholder diagram template. FigJam’s design tools take care of the formatting and drawing for you, so you can focus on specifying your stakeholders and figuring out where they fit.
Start placing stakeholders at the center of your onion diagram template and work outward. Once you’ve finished four to five layers of stakeholders surrounding the core, you have the option to add lines between stakeholders to define how they relate.
It’s a good idea to collaborate on your onion chart with team members to ensure that your information is accurate and to strengthen bonds across your entire organization.
An onion diagram is used to gain a deeper understanding of an organization’s stakeholders. With insight from an onion diagram, stakeholders can see how they might support an initiative.
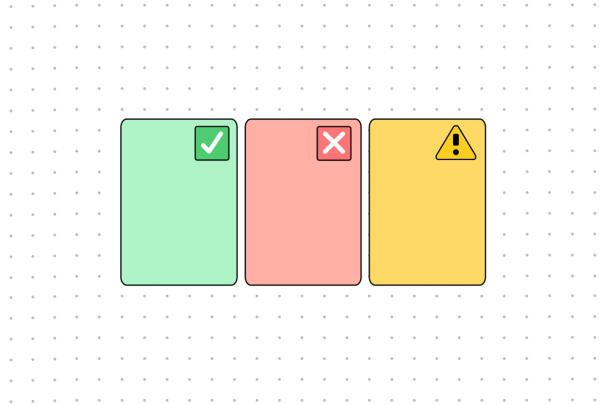
But that’s not all. With some clarity from an onion chart, project managers can anticipate how certain stakeholders might react to an update, determine who to turn to for help with a venture, and tailor communication to fit varying layers of influence.
Other templates you might like


Explore 1,000+ templates on the Figma community
Explore even more templates, widgets, and plugins—all built by the Figma community.

