FigJam
Get the ball rolling with value chain analysis template
Increase efficiency and streamline company processes with the potential for improvement using our team-friendly template.

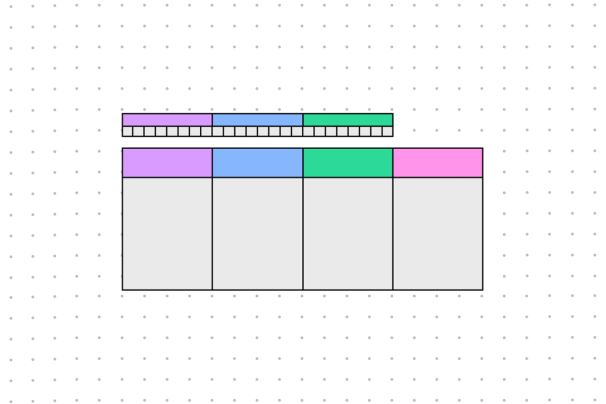
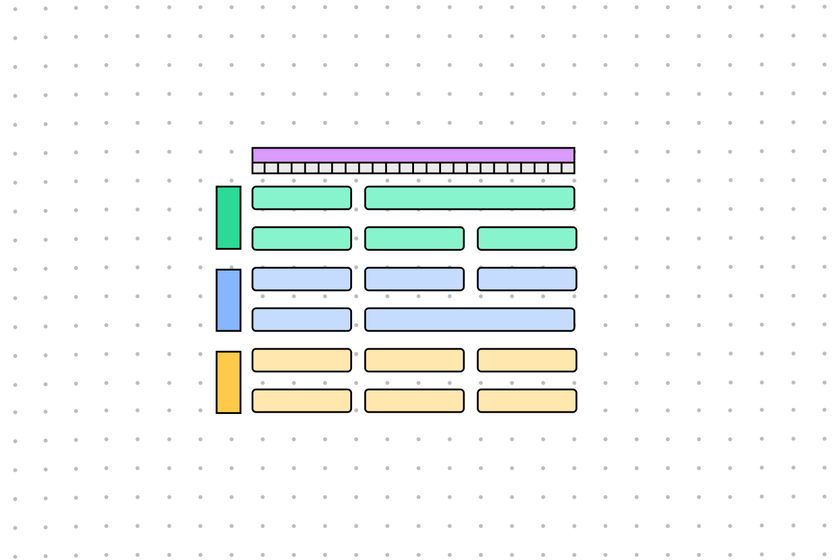
Value chain analysis template
Visualize your project’s 5 key functions and rework slowdowns, together.
Game your processes
You don’t have to be a pinball wizard to steer clear of inefficiencies and score opportunities. Dodge the bells and whistles for a clear-cut shot at success.
Take an overview: Enjoy a bird’s eye view of the intricate internal activities used to transform inputs and outputs.
Save your quarters: Visually identify opportunities to reduce costs along the way.
Spring into motion: Figure out support activities to aim for, and which to dodge, for smooth gameplay.


FigJam
Multi-player friendly
FigJam templates are made for high scores and collective wins. Get help from your team and steer the ball in the right direction with our strategic planning resources and Community-built widgets like Badge, Flip Card, and Flashcard. Teamwork. That’s the ticket.
Enter the arcade
Light up the scoreboard together with extra tools from our Community. Don’t bother fishing for change—FigJam templates are free every time.


FAQs
This method of reviewing your product’s journey is used to identify areas that need improvement to ultimately increase efficiency. With an example of value chain analysis, you can discover how to deliver high value at a lower cost.
What are the advantages and disadvantages of value chain analysis? Value chain analyses can unveil potential roadblocks and smooth out processes and projects to ultimately build acompetitive advantage. But they can also require time and care to perform.
Wondering how to do a value chain analysis? Begin by gathering your team together to build a visual representation of your project that encourages creative problem-solving. With FigJam, you can get an editable value chain analysis template free of charge. Look at you—already cutting costs and inefficiencies!
Three primary steps go into performing a value chain analysis.
1. Collect information and data that relates to the activities in your product or process.
2. Identify how much each activity costs. Is there customer value?
3. Analyze your analysis as a team for links along the chain that could benefit from improvement. Use that insight to cut costs and increase value.
All activities in a value chain analysis example can be broken down into two overarching labels: primary and support activities. Primary categories act as umbrella labels and are the title of each row. Supporting activities are broken-down tasks that fall into each category.
If you’re wondering by value chain analysis is important, consider the level of detail that the charts delve into. Value chain analyses take minute detail into account, making them a perfect tool for teasing out less obvious snags in your workflow. Unlike other charts, activity interconnection isn’t highlighted so it’s easy to lose track of how supporting activities influence the process as a whole.
Other templates you might like


Explore 1,000+ templates on the Figma community
Explore even more templates, widgets, and plugins—all built by the Figma community.

