FigJam
Deliver satisfaction with a value stream mapping template
Whether you’re developing a product or managing a project, you’ll want to deliver maximum value. FigJam’s simple value stream map examples help you eliminate wasteful practices so you can amp up your operations.

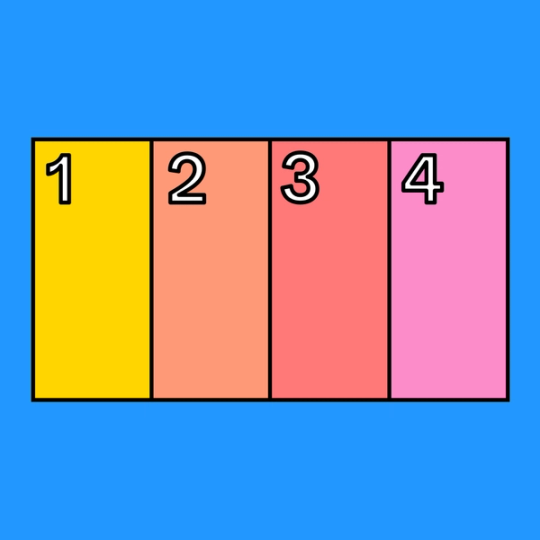
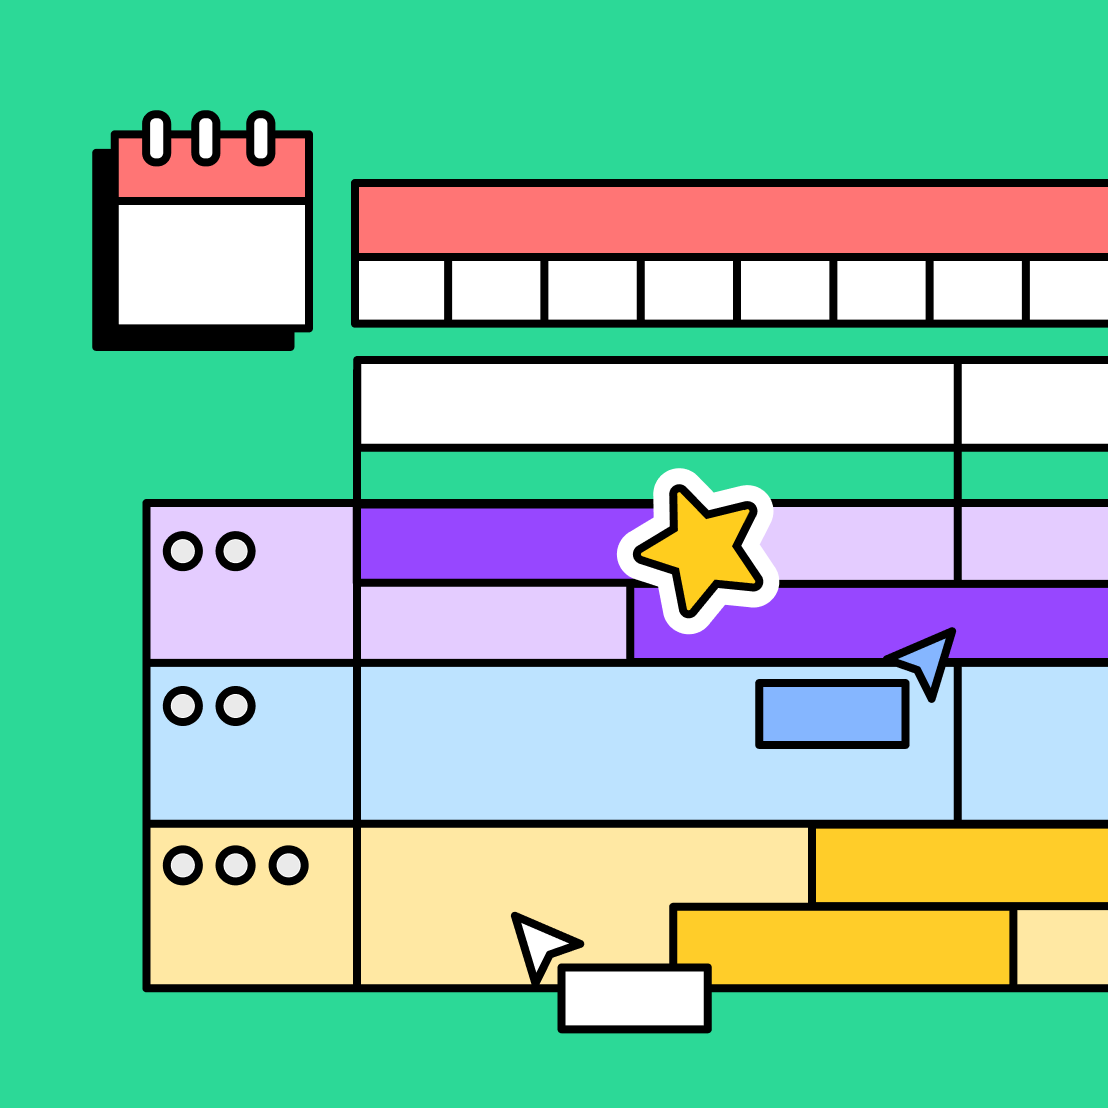
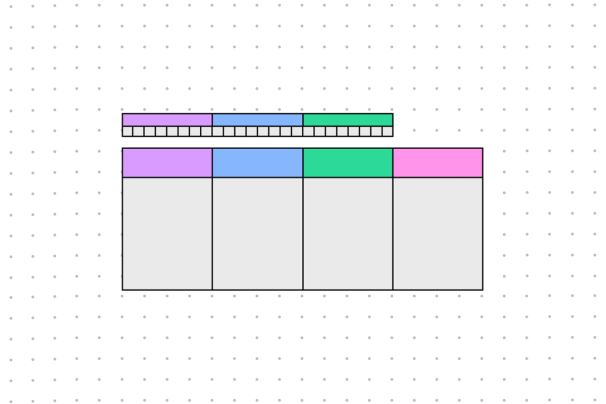
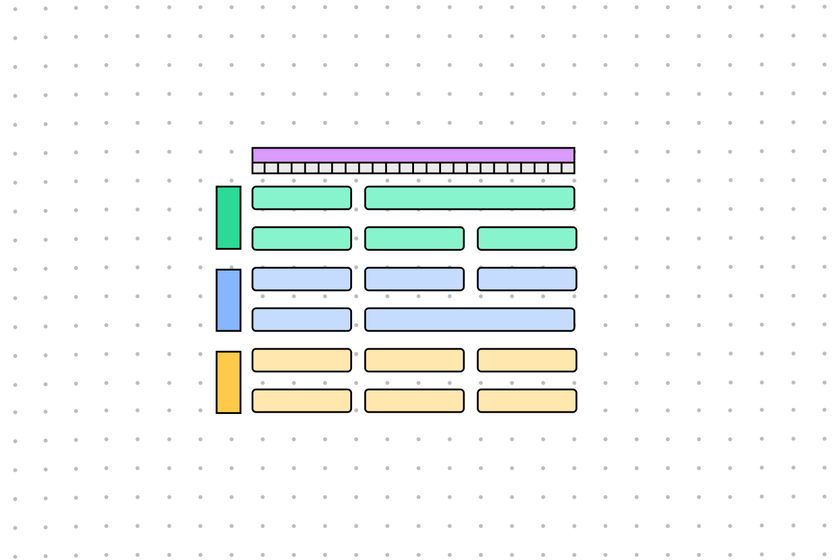
Value stream mapping template
Define what’s at play in product development to build a more effective and efficient process.
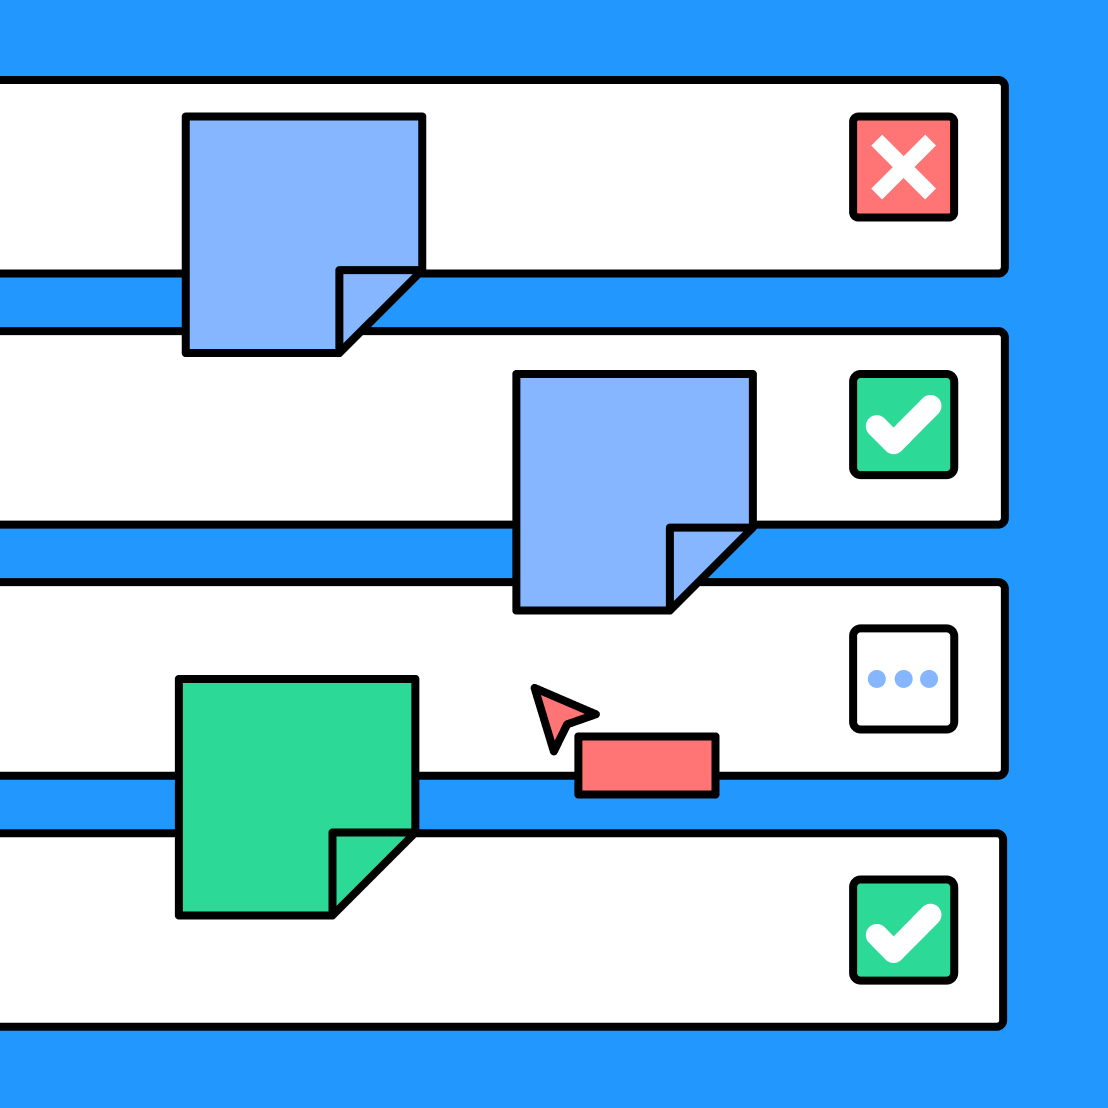
Don’t take your ops at face value
Provide your customers with the best possible experience by understanding your operation—inside and out.
Problem-free efficiency: Map your process to eliminate costly redundancies and time-wasting practices.
Do it for them: Give your customers the streamlined, satisfying user experience you would want.
Mind the gaps: Use the sample value stream map template to identify hidden holes in your current process.


FigJam
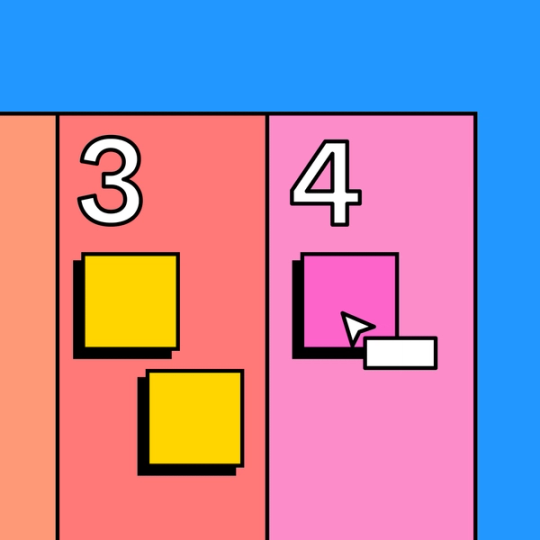
Find value at your fingertips
It’s impossible to create a thorough value stream map without input from your team. FigJam’s shared online canvas makes it simple to source information and feedback from the folks on the ground. Connect with cursor chats, emphasize with emotes, and fold in real-time data to better understand your product and your process.
Ready, get set, strategize
Good information is your best weapon in the fight against inefficiency. Our Community templates are here to help, every step of the way.


FAQs
A value stream map is a flowchart that is used to diagram every individual step in a given process, and identify wasteful practices that cost your organization valuable time and money.
Value stream map tools are lean thinking tools, used to identify waste– inefficiencies, redundancies, and unnecessary steps in a process. They allow organizations to lay out their operations in a visual format and gain a more thorough understanding of their current state.
If you’re wondering how to read a value stream map or build your own, FigJam makes it easy to understand the different components involved in your process—and how they interact.
Simply tap into our free value stream map template and complete the following steps:
Find a focal point – Determine what value stream you’ll be mapping.
Start from the end – Start your map from the customer end, and trace your process backward, step by step, to the beginning. Ensure that your information is reliable and up to date by consulting with each department involved. On FigJam, sharing data is intuitive since every team can log onto and deliver feedback to the map itself.
Fill in the relevant data – Populate your map with data from each process step—wait times, number of employees involved, yields, and number of defects to name a few. This information will differ depending upon your industry.
Break it down – Observe your compiled data, and do the math. Take what you’ve learned and use it to eliminate waste from the process flow.
Other templates you might like


Explore 1,000+ templates on the Figma community
Explore even more templates, widgets, and plugins—all built by the Figma community.

