
How to run great daily stand-up meetings
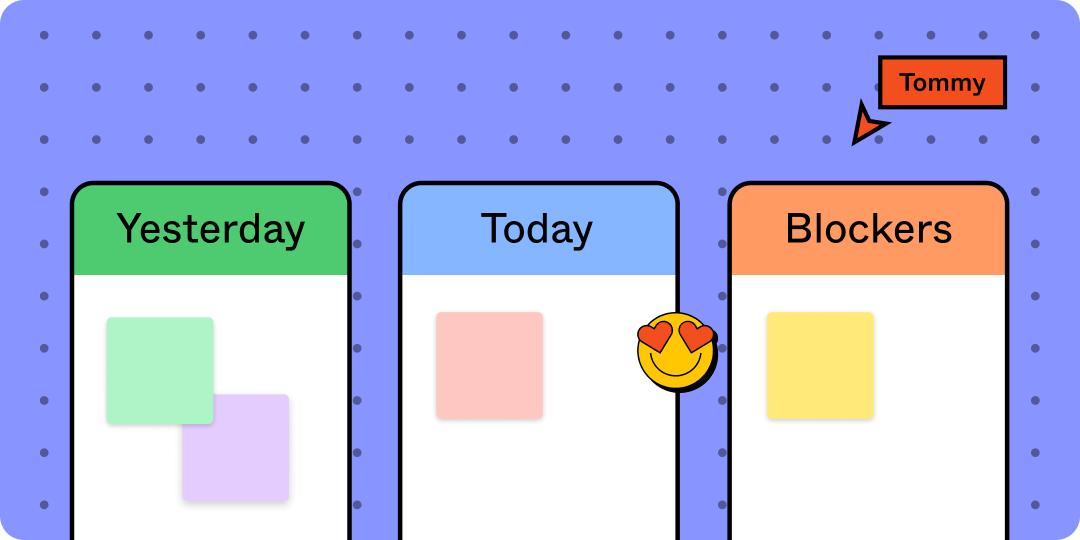
Whether you're new to daily standup meetings or are seeking to improve your existing standups, these tips and templates straight from the Figma team can help.
Skip to main content
Unlock your team’s full potential with guides on collaboration, workflows, and productivity best practices.
Featured articles
Whether you're new to daily standup meetings or are seeking to improve your existing standups, these tips and templates straight from the Figma team can help.

Diagrams can help you run more effective (and fun!) Sprint retrospectives with your team. Learn how to improve your Sprints in just a few minutes with FigJam.

Learn how to write SMART goals that are specific, measurable, attainable, relevant, and time-bound. This guide breaks down each element with clear examples.
Whether you're new to daily standup meetings or are seeking to improve your existing standups, these tips and templates straight from the Figma team can help.
Diagrams can help you run more effective (and fun!) Sprint retrospectives with your team. Learn how to improve your Sprints in just a few minutes with FigJam.
Learn how to write SMART goals that are specific, measurable, attainable, relevant, and time-bound. This guide breaks down each element with clear examples.

Project status reports are essential for keeping team members and key stakeholders up to date. Learn how to create a status report for free using FigJam.

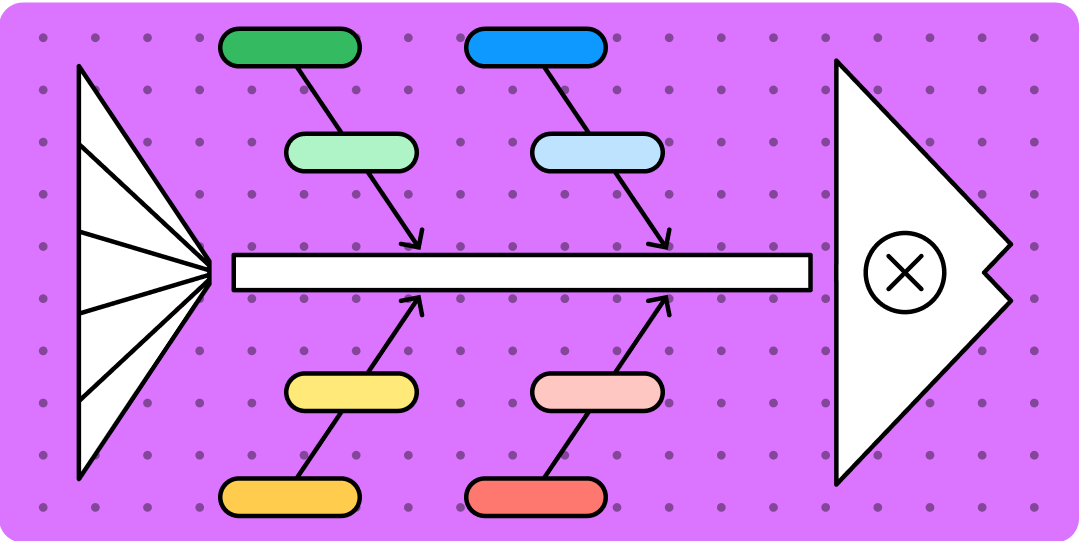
Use a fishbone diagram to help you solve problems by understanding what’s causing them. Learn how to make one using FigJam’s fishbone diagram template.

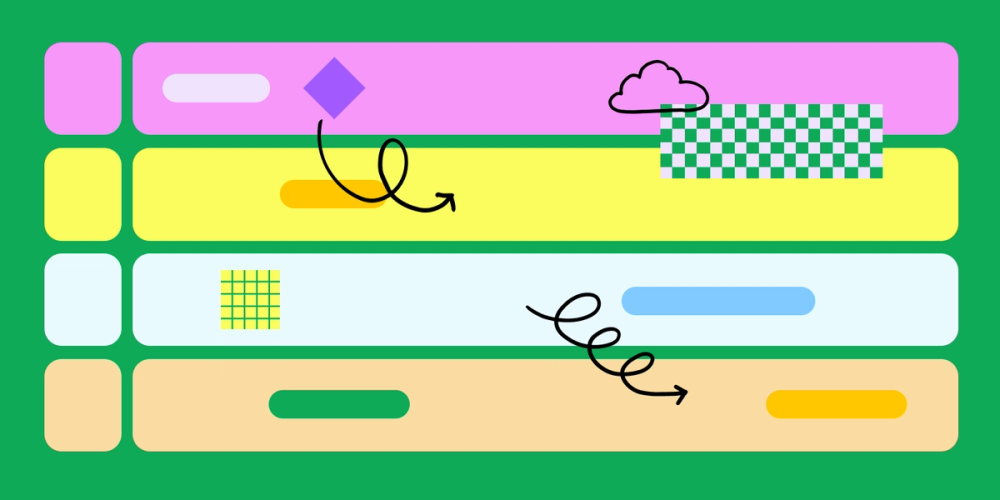
Learn what a swimlane diagram is, how it can clarify complex workflows, the key components of a swimlane diagram, and when to use one to improve collaboration.

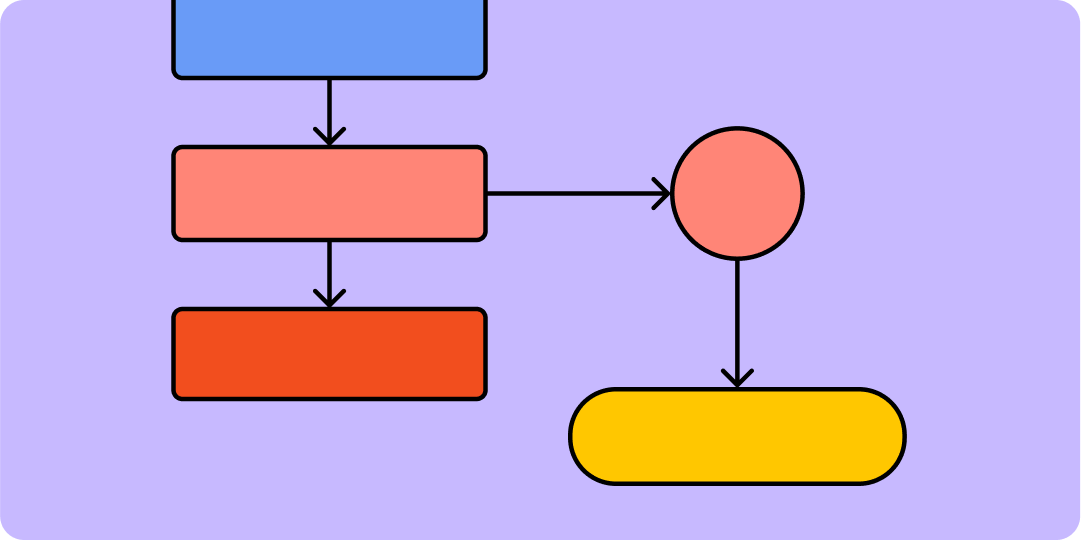
Having a flow chart can help visually represent actions or people in a complex situation. Read on to learn how to create a flow chart.

Brainstorming sessions feeling scattered? Read our guide below as we walk you through our top tips for how to use the lotus diagram technique.

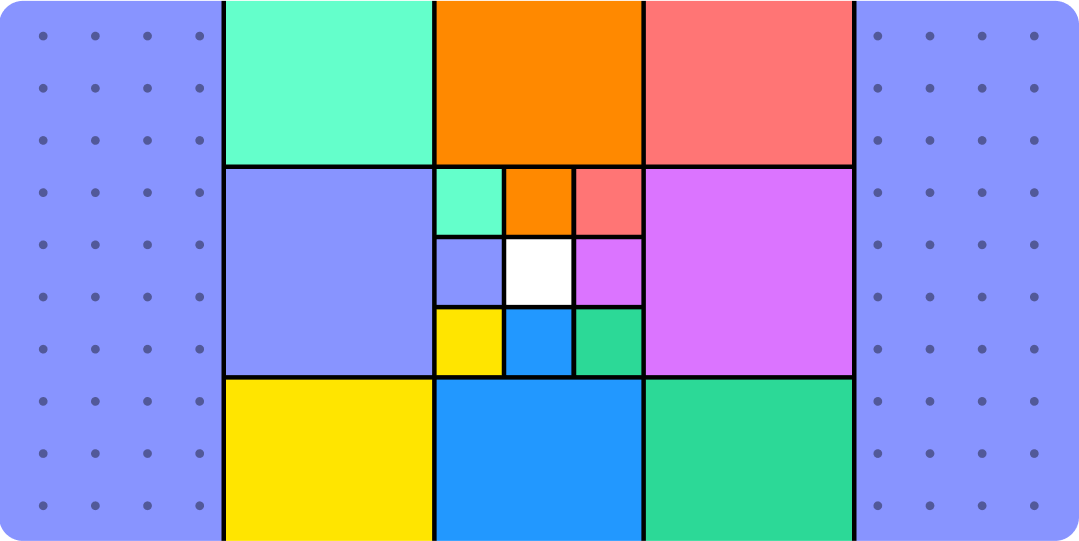
The Eisenhower matrix is a simple diagram that helps prioritize tasks based on importance and urgency. Learn how to make one using FigJam’s ready-made template.

Discover the art of process mapping—a technique designed to show the steps of a process from start to finish. Learn how to create your own process map, along with examples and templates.

Concept maps organize and connect a set of related concepts in a simple visual diagram. Learn how to make a concept map using FigJam’s ready-made template.


Demystify project timelines by learning what a Gantt chart is and what it’s used for. Plus, discover how to make a Gantt chart in five simple steps.

Effective meeting notes help teams align on key action items and decisions during meetings. Learn how to take better meeting notes with FigJam.

Entity relationship diagrams help designers and developers collaborate on efficient, user-friendly systems. Learn how to create an ER diagram with FigJam.

Ready to take your brainstorming to the next level? Learn how to use the 5 whys root cause analysis method to get to the heart of a problem with FigJam.

Check out over 53 icebreaker ideas, activities, games, and tips that’ll help you facilitate an unforgettable team meeting.
Explore all topics