FigJam
Sort projects and products with the alignment chart template
From characters to color schemes, you can categorize anything and everything using one of FigJam’s meeting templates.

Alignment chart template
Bring the whole team together for a humorous icebreaker or take a stab at stacking up presentation ideas.
Align your team with alignment charts
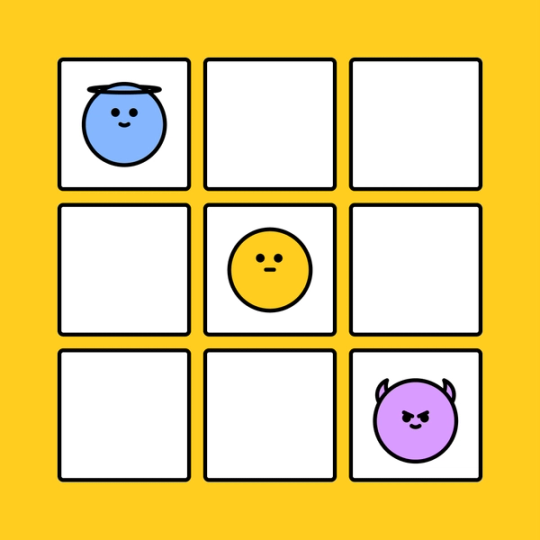
Make sorting more engaging by classifying characters, products, projects, and more based on the basic dimensions of “good” vs. “evil” and “lawful” vs. “chaotic.”
Aid in the planning process: Develop quizzes, brainstorm ideas, or examine concepts for upcoming content creation
Analyze and develop characters: Sort characters into categories based on their actions and personalities.
Anticipate users’ reactions: Get clarity on how your users might react to certain characters or aspects of a product.


FigJam
Have a lawfully good time together
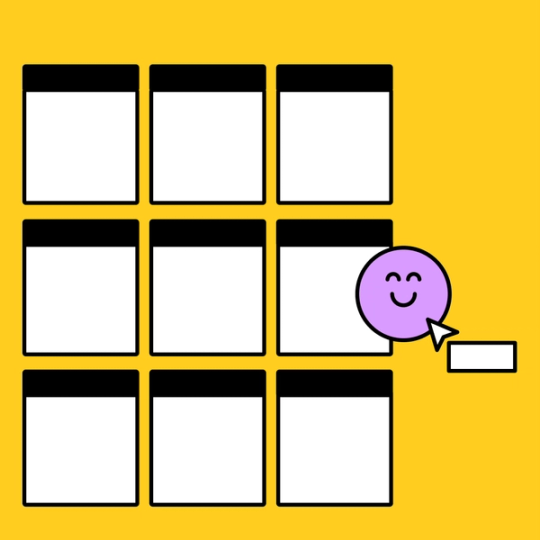
Use FigJam’s character alignment chart examples to create a fun and collaborative atmosphere for the whole team. Can’t agree on where to place a character? With cursor chats, polls, and emotes into the mix, everyone can easily share their input.
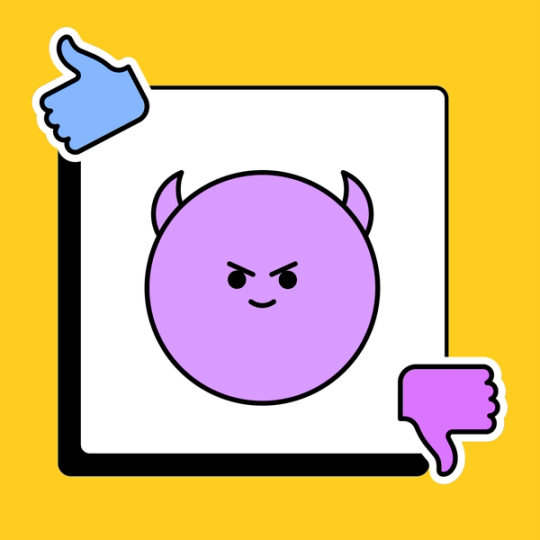
The choice is yours—lawful or chaotic?
Categorize to your heart’s content. To make meetings even more captivating, explore other templates from our Community.


FAQs
An alignment chart is a useful tool designed to categorize different characters, ideas, or concepts. Most charts include different sections around “good” vs. “evil” and “lawful” vs. “chaotic," resulting in a 3x3 grid with each character (or concept) plotted within each box.
To use an alignment chart—a grid that sorts people, places, things, or ideas into nine different categories that range from “lawful good” to “chaotic evil”—begin by picking a topic. Books, movies, your company’s product line. Anything goes.
Say we’ve landed on the Harry Potter series. How would we categorize the main characters within the framework of an alignment chart?
First, we’ll choose pictures to represent the characters we’re categorizing. Next, we’d collaborate with our team to decide where each picture should go. Many people would agree that Hermione Granger is the ideal choice for “lawful good” while Lord Voldemort is an easy pick for “chaotic evil.” “Chaotic neutral” and “lawful evil,” however, are more of a gray area and may require some debate (watch out, Gilderoy Lockhart).
You can make an alignment chart by hand, or you can start by downloading FigJam’s free alignment chart maker.
Fill each of the nine squares on the 3x3 grid with the characters, concepts, or projects that correspond to its category—“lawful good,” “neutral good,” “chaotic good,” “lawful neutral,” “true neutral,” “chaotic neutral,” “lawful evil,” “neutral evil,” or “chaotic evil.” Learn more about how alignment charts work.
The roots of the alignment chart go back to 1977—the year that the role-playing game Dungeons and Dragons hit the market. D&D players filled out alignment charts to determine which moral code their character would follow as the storyline unfolded. More recently, alignment charts have entered the mainstream. They can be used in everything from team bonding to user persona research.
Alignment charts can help foster communication and collaboration between team members. To make the most of the activity, prioritize the following tips:
- Create an open environment that encourages team members to share their innovative ideas, thoughts, or opinions.
- Ensure all team members have done their research and are aligned with the characters or concepts they're categorizing.
- Keep the conversation flowing. Incorporate cursor chats, polls, and emojis within the planning process.
Other templates you might like


Explore 1,000+ templates on the Figma community
Explore even more templates, widgets, and plugins—all built by the Figma community.

