FigJam
Crank up the heat with our burndown chart example
Track your next epic or sprint in style, then finish the remaining work with agile roadmaps, Fibonacci scale templates, and more—all from FigJam.

Burndown chart template
Use a burndown chart generator to ignite passion for project management and track your project progress within your entire team.
Feel the burn
Motivate the squad, keep managers in the loop, and define what’s next with a visual sprint burndown chart.
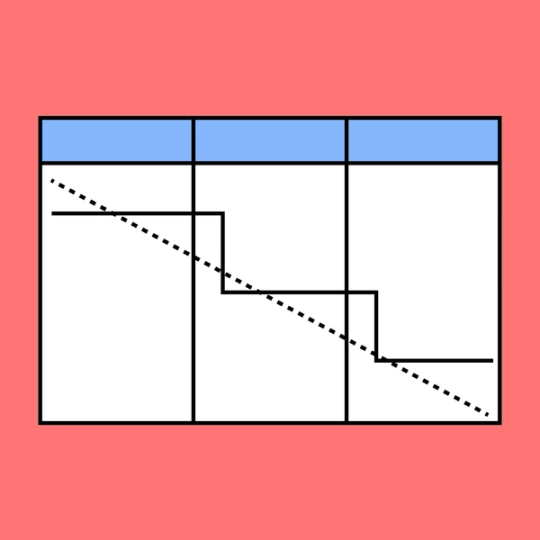
Look at what’s left: Stay on track with a graph that shows work remaining vs. time remaining.
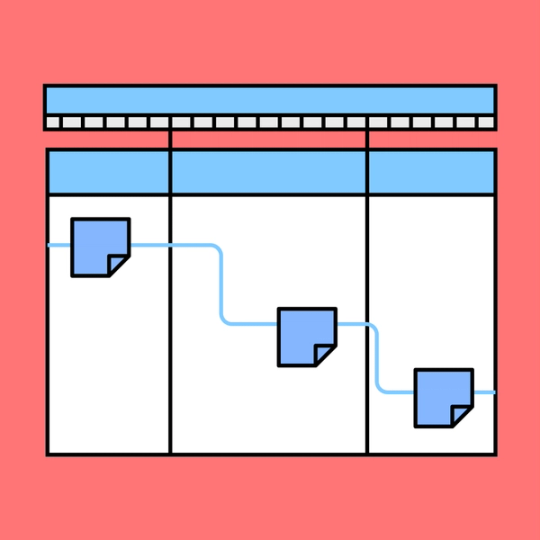
Celebrate your steps forward: Create a visual representation of your progress, sprint backlog, and overall productivity.
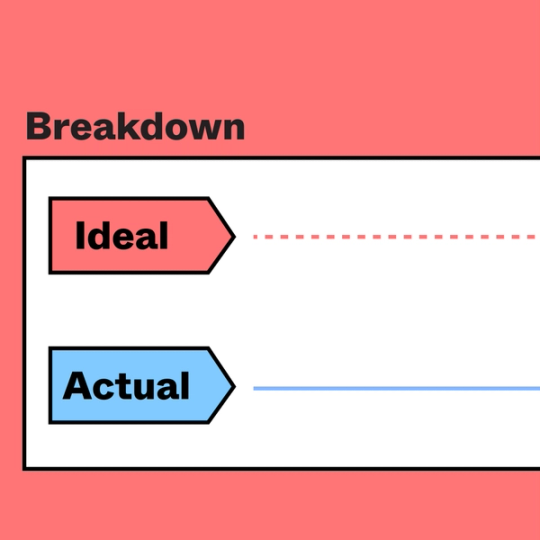
Manage money and time: Demonstrate the difference between the “ideal” timeline and the actual workflow to better allocate resources.


FigJam
Light a fire under your team
Showcase your project’s progress to sprinters and stakeholders alike on a collaborative canvas. When you build your burndown chart online with FigJam, you give each member access to feedback features, creative tools, time-saving widgets like Calendar, and more.
Finish your project in a blaze of glory
Spark some newfound motivation with our sample burndown chart. Fan the flames of productivity with more tools, tips, and templates from our community.


FAQs
You’ll notice that every agile burndown chart example shows two lines on a graph. These lines indicate your burndown rate.
To calculate the slope of your graph (also called the burndown velocity), you’ll compare your initial timeline estimation with the actual time your project is taking.
The equation for this calculation is simple: divide the hours of work remaining by the average productivity rate (the hours of work completed each day). Your result tells you how many days it will take to complete the project if you continue at your current rate.
Burnup and burndown charts fulfill the same purpose, but there’s one crucial difference. A burndown chart shows you the estimated effort needed and how much work is left. Each time you finish up a task, you remove it from the chart—in other words, you’re burning down your remaining work.
On the other hand, a burnup chart shows how much work you’ve completed. Finished tasks are added to the vertical axis to demonstrate progress.
Overall, choosing between a burnup and burndown chart is a matter of preference.
To make a burndown chart, you’ll need a graph with a date range on the x-axis and an “hours worked” section on the y-axis. From there, you can chart your progress each day or week.
The easiest way to create burndown chart trackers for yourself is to start with a template from FigJam. Our burndown chart template gives you an immediately understandable starting point, endless customization options, and an array of tools and widgets to help you answer those burning questions and reach your upcoming deadlines.
Other templates you might like


Explore 1,000+ templates on the Figma community
Explore even more templates, widgets, and plugins—all built by the Figma community.

