FigJam
Feel out the flow of your data with our context diagram example
Whether you’re perfecting your subscription process, revamping information sharing among your team, or sketching out steps for a passion project, FigJam’s context diagram examples help you find your flow.

Context diagram example
Trace the scope of your projects and processes together, with a collaborative context diagram tool.
Don’t get taken out of context
See how your system relates to internal players and outside forces, then share the high-level view with your stakeholders.
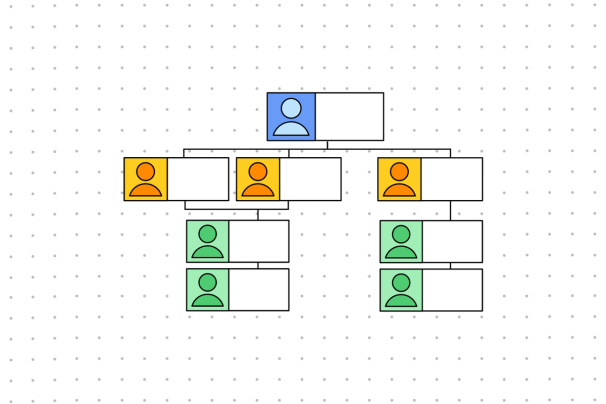
Draw boundaries: Outline the scope of a system and roles of major entities to help your team understand the big picture.
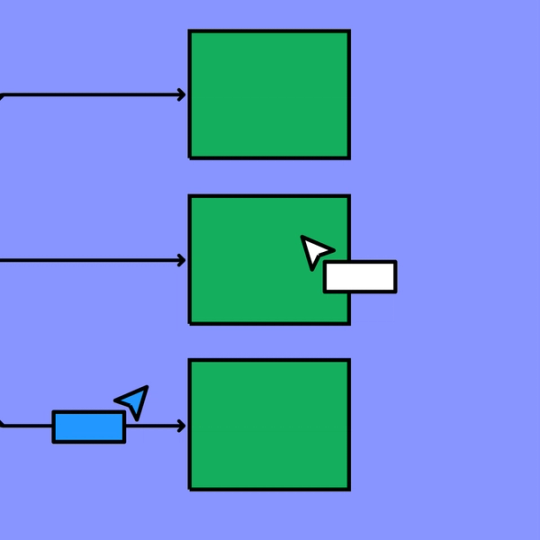
Encourage cross-functional collaboration: Bring your technical team and business team together with a broad system context diagram that can easily level up for further insights.
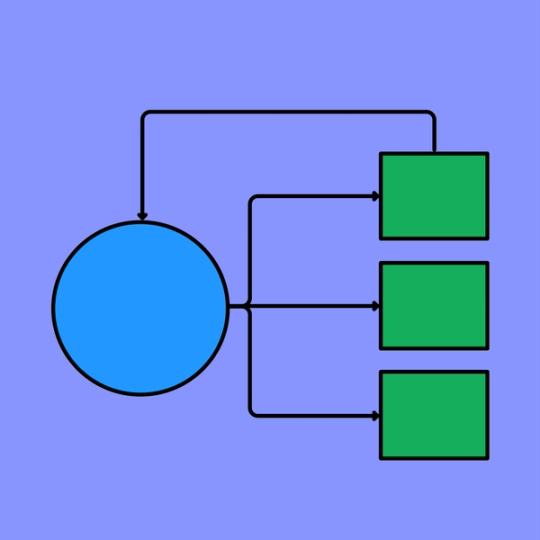
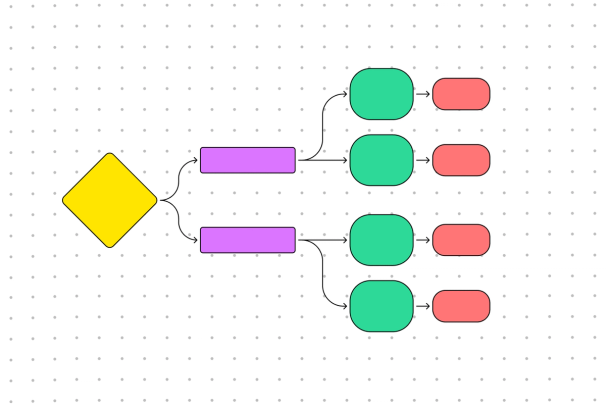
Connect your systems: Show how one system can influence processes in another to give an abstract impression of how data flows.


FigJam
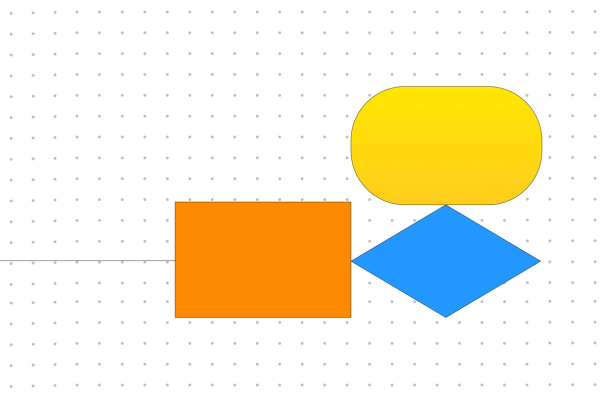
Broad strokes, big insights
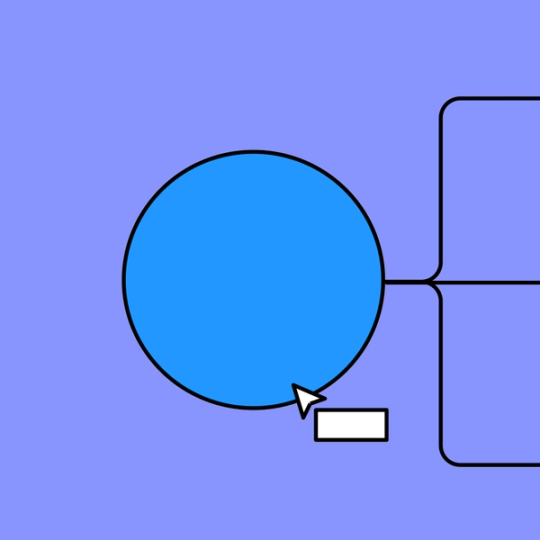
With FigJam’s context diagram maker, you can map out your system as a single, easy-to-read process. Shared workspaces, chat functions, and collaborative widgets, empower everyone on your team to pick up a brush—and see the full picture.
See what’s in store
Share the birds’ eye view of your system across departments. Then, zoom in with templates from our Community.


FAQs
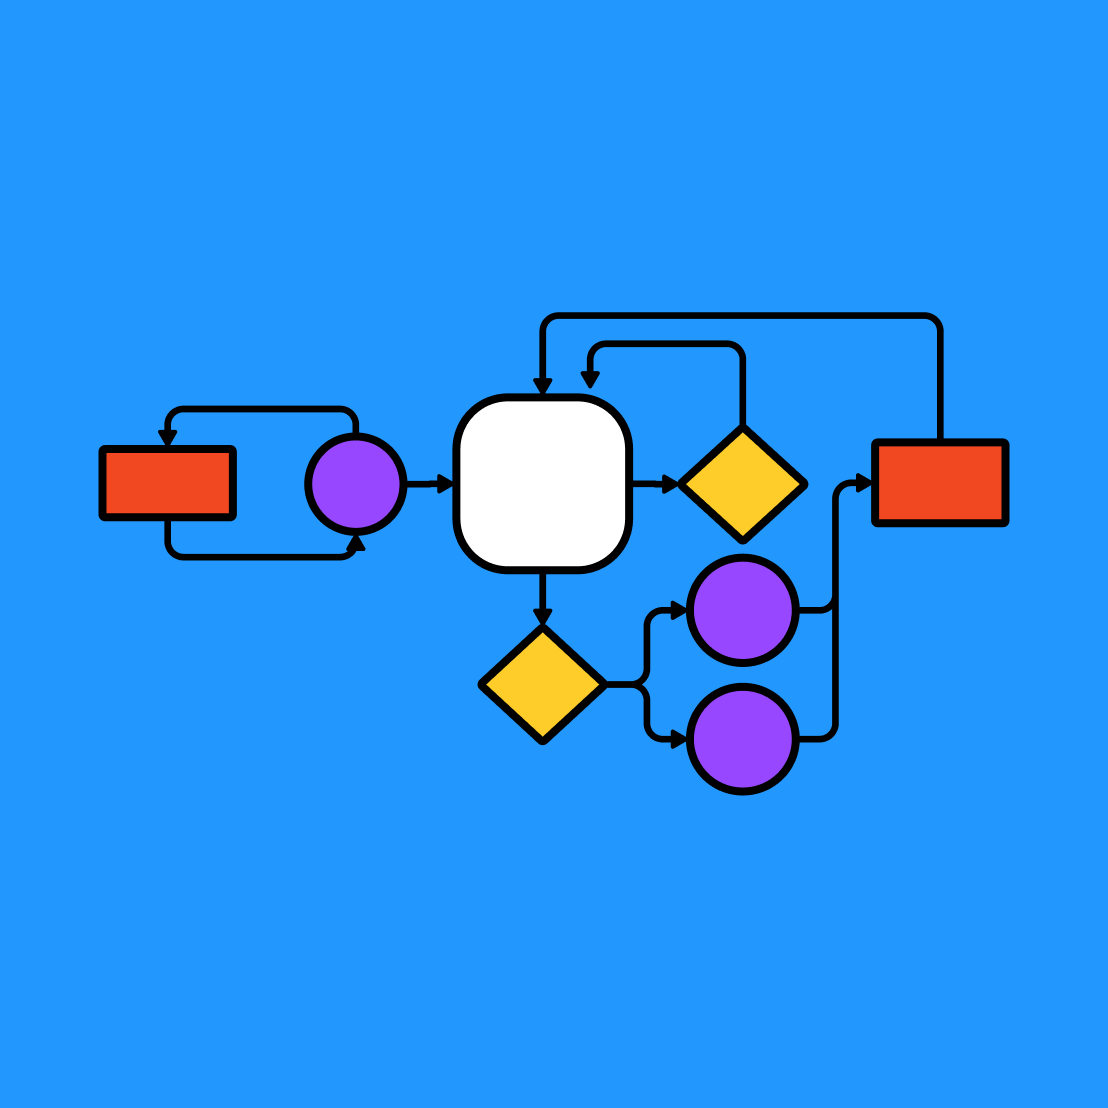
A context diagram, also known as a level 0 data flow diagram, is a high-level snapshot of the flow of information in a system. Systems can be widely defined, including an online community, an entire software system, an internal communication flow, and more.
When considering how to make context diagrams, it’s important to keep your intended audience in mind. These broader representations are perfect for stakeholders, managers, and business analysts who don’t often delve into the technical nitty-gritty.
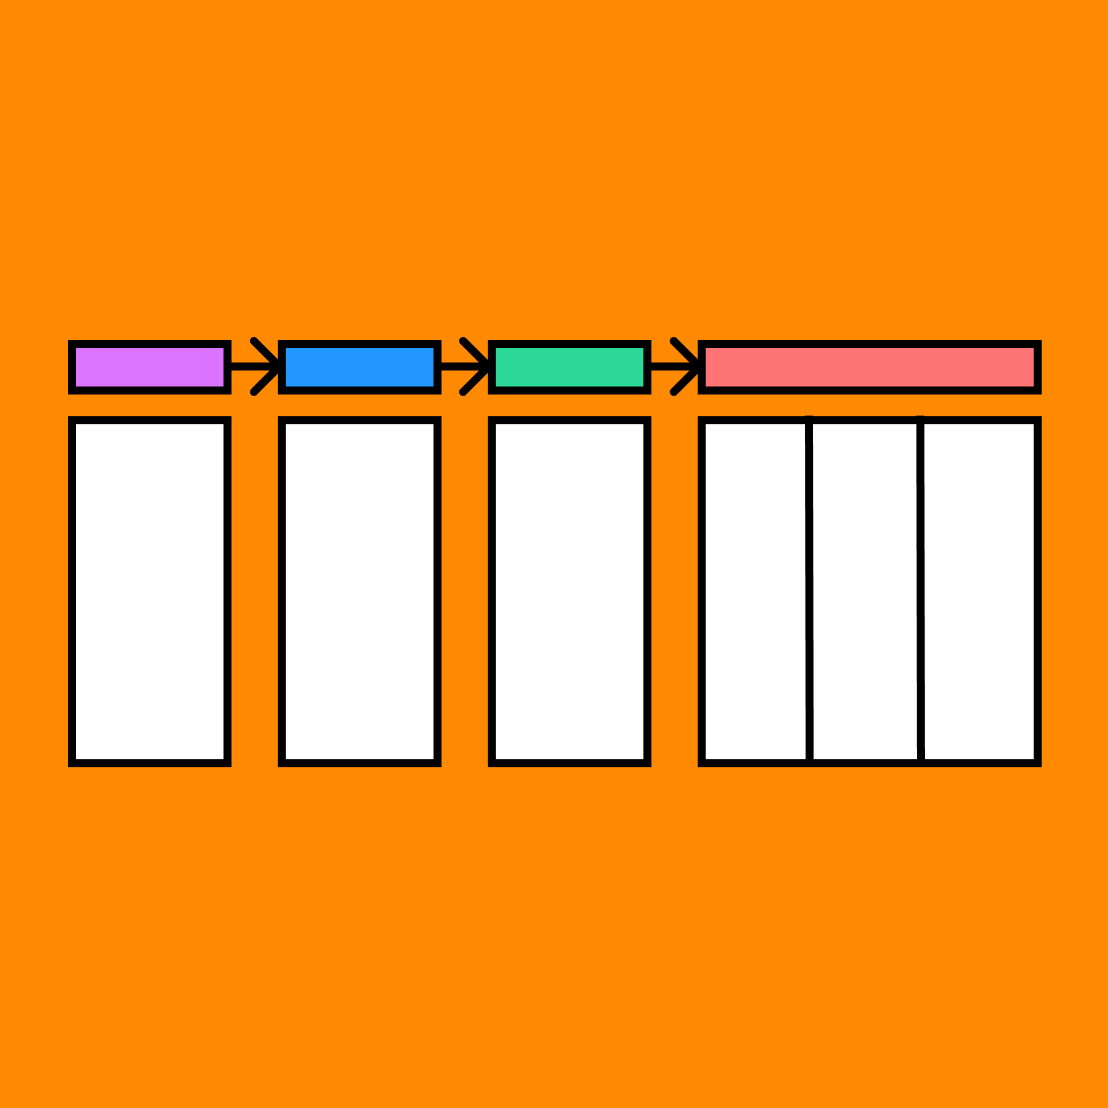
Context diagrams show the system as a whole—labeling each process and how information travels from one step to the next, without going into detail about any of the features in the process. They tend to be abstract, providing a high-level overview of any given system that’s easily digestible for nontechnical folks.
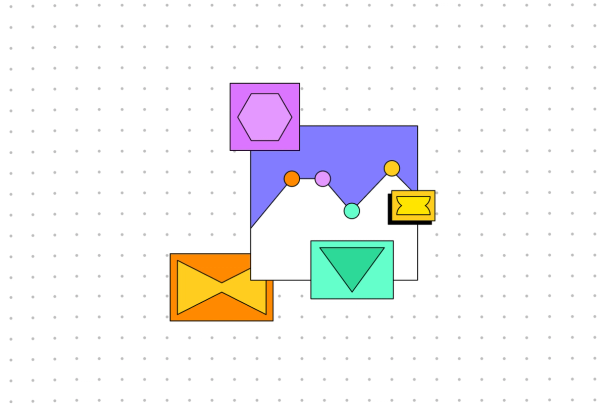
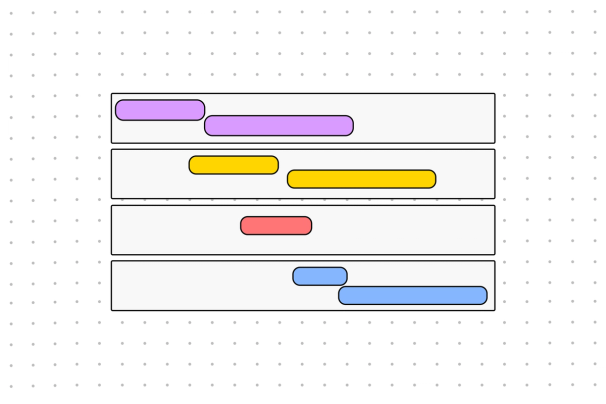
Level 1 data flow diagrams zoom in on the context diagram, focusing on a single sub-process of the entire system and mapping it out in detail.
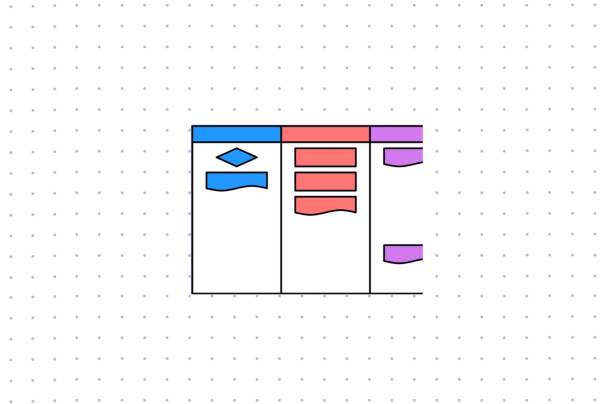
Ready to level up? Level 2 data flow diagrams take a deeper dive into the data than both the level 0 DFD and level 1 DFD. By providing a detailed framework of a system’s operations and functions, a level 2 DFD can serve as a blueprint for the engineers organizing your data collection and storage.
Whether you’re after an abstract entry point or an intricate map, FIgJam’s free context diagram template and data flow diagram examples make it easy to build a strong foundation for your systems—and take them one step further.
Other templates you might like


Explore 1,000+ templates on the Figma community
Explore even more templates, widgets, and plugins—all built by the Figma community.

