FigJam
Form your own entity relationship diagram example with our customizable template
Illustrate and understand interconnectedness with relationship diagram templates, kinship diagrams, data flow charts, and more. Visualize associations of all kinds using FigJam templates.

Entity relationship diagram template
Form connections with your team by plotting connections between entities using this editable entity relationship diagram template.

Relationships don’t have to be messy
Trying to suss out your system’s relationship status? “It’s complicated” isn’t going to work. Visualize complexities with a relationship diagram template.
Embrace simplicity: Present any entity relation plainly with an easily readable diagram.
Harness visuals: Rely on symbols and color-coding to keep read time of an er model to a minimum and make it make sense for all stakeholders.
Keep your options open: You don’t have to commit to just one diagram—an entity relationship diagram example can be converted into any other data model.


FigJam
Find connections, stay connected
Link up your entity relationship model with the entire team in an interactive environment. With ready-made shapes that snap to the grid, access to on-brand content from anywhere, and countless ways to collect feedback, a stunning and functional diagram is more than a possibility—it’s the norm.
Your #RelationshipGoals are within reach
Highlight any relationship set and find new ones in any system. For more free relationship advice, join the FigJam fam and access templates from our Community.


FAQs
An entity relationship diagram (or ERD for short, or ER diagram for slightly longer) is a graphic that demonstrates the links between actors and business objects in a system. But who would use one? And what is an entity relationship diagram for?
Web and software engineers will often implement them to develop or document a database’s structure, but you can use an entity relationship diagram tool to showcase any interconnected system.
The purpose of an er diagram, then, is to represent how everything fits together. The ultimate goal is to find inconsistencies and opportunities for improvement.
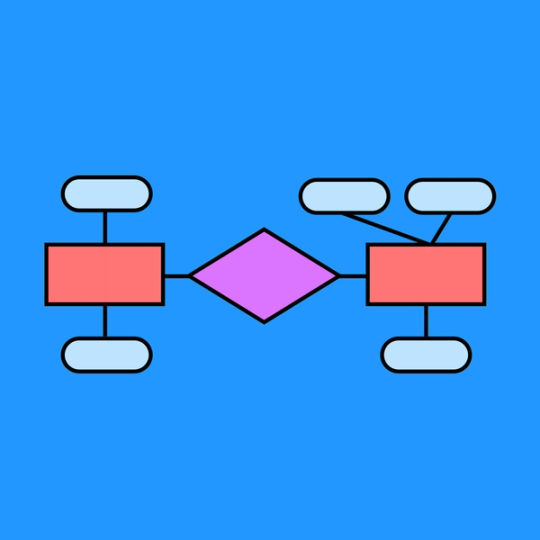
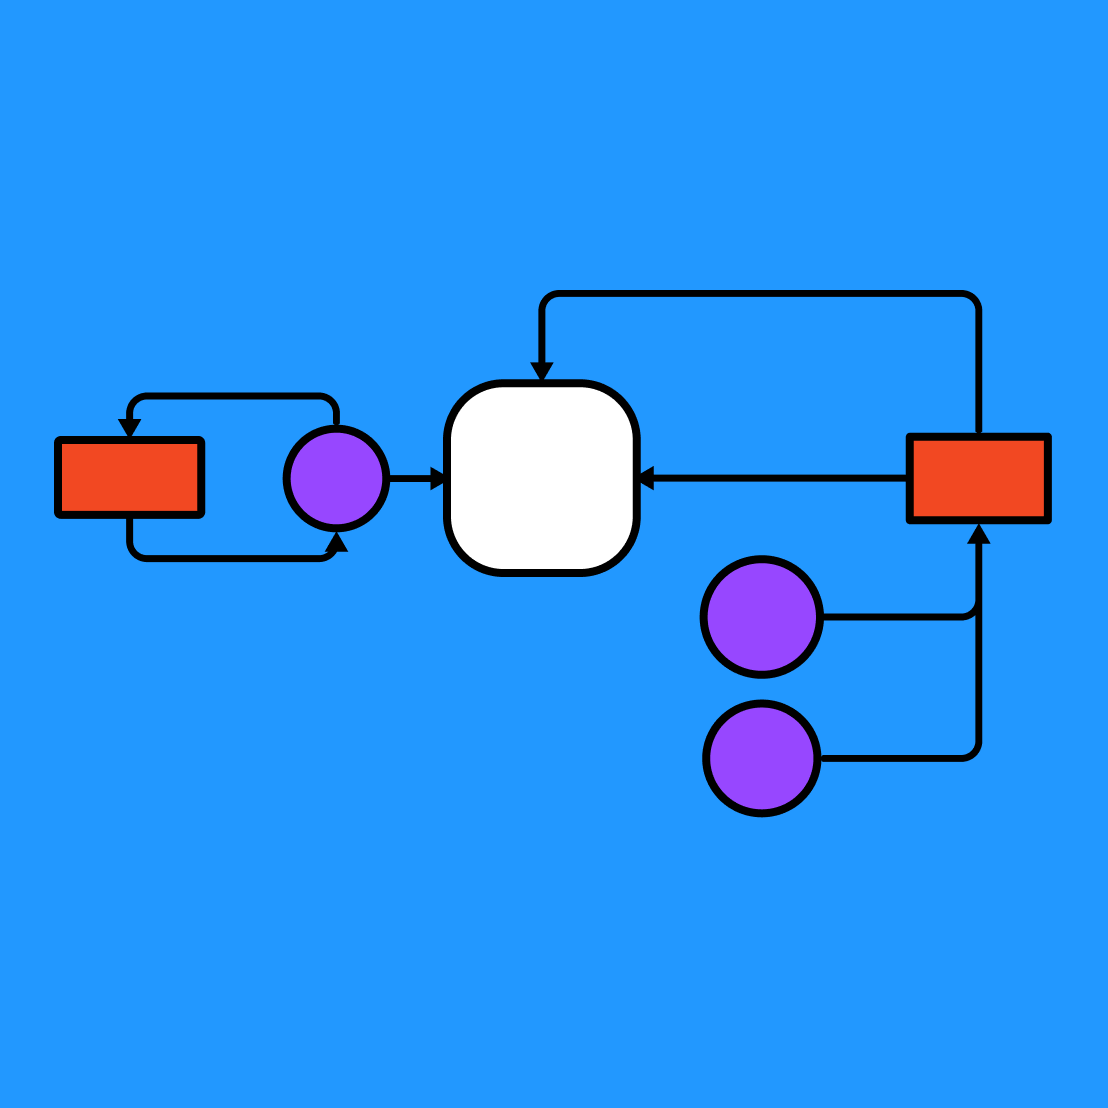
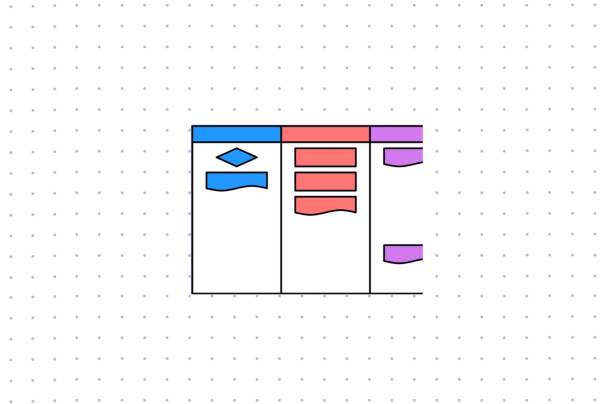
When you look through examples of entity relationship diagrams, you’ll generally see the following three components:
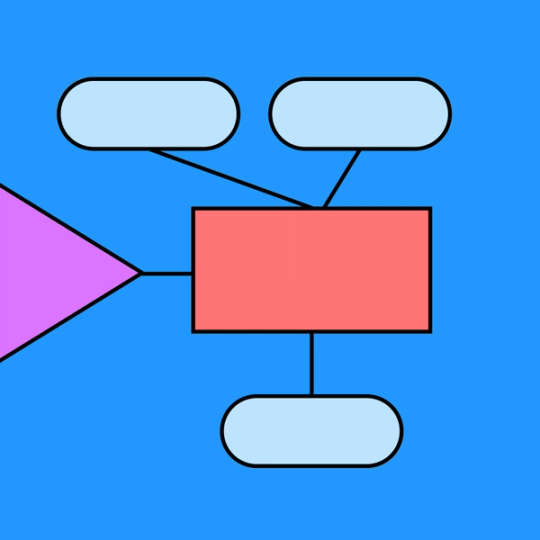
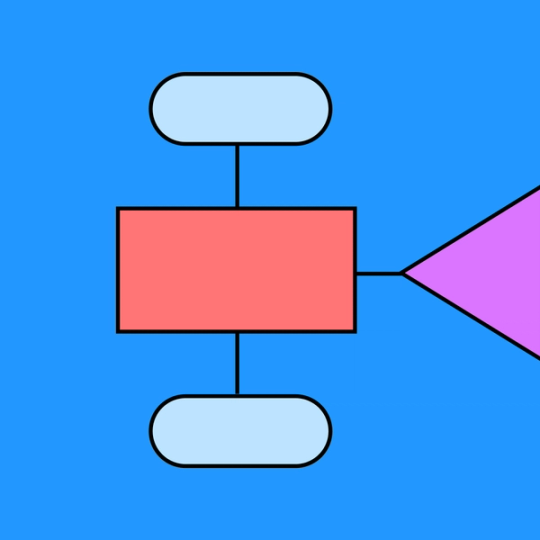
- Entities – Also called actors, entities are the “main characters” of your diagram—usually a person or an object. They’re often represented by rectangles.
- Relationships – The relationship defines the way two entities are connected. For instance, let’s say you have the entities “customer” and “product.” The relationship would be “purchases.” This component is typically diamond-shaped.
- Attributes – Attributes are the characteristics of an entity. They usually surround a relevant entity and give further context to its role in the system. In a standard example of entity relationship diagram, attributes are ovals.
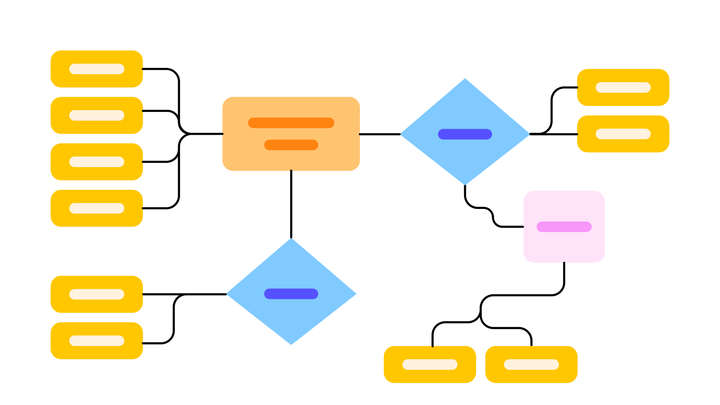
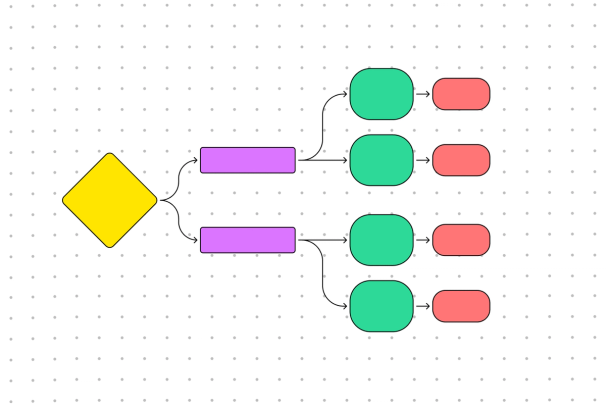
Typically, entity relationship diagram examples come in the form of a flow chart. If you want to create an ERD with a strong relational database, you’ll need a set of shapes and connectors that can all join together, creating a web of interconnected concepts.
On top of an er diagram template, you’ll also need to bring together a team that understands the system you’re describing. Start by listing out your entity type(s), then define their relationships to each other. To finish up, you can add attributes to give further information.
In short, you’ll need two things: teamwork and a flexible template. With FigJam, it’s easy to find the balance between collaboration and creative expression. Hop into a shared whiteboard space to chat about your diagram, add links to other documents, and choose from a laundry list of shapes and connectors—it’s all right here, ready for you to use.
Here are a few use cases for using entity relationship diagram templates:
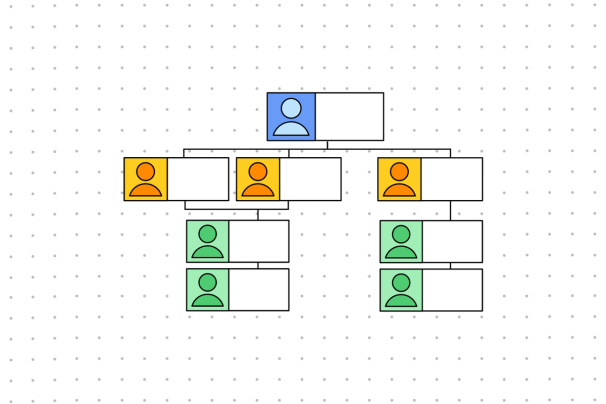
- Entity relationship diagrams can help cross-functional teams understand the relationship between entities. Use it as an educational tool to visually map out objectives and find connections.
- Create ER diagram templates to help design product features by defining key entities and visualizing the relationships between them. Plan out product workflows and use the diagram as a tool to pinpoint potential roadblocks or opportunities for improvement.
Other templates you might like


Explore 1,000+ templates on the Figma community
Explore even more templates, widgets, and plugins—all built by the Figma community.

