FigJam
Configure your flow with the data flow diagram example
Use the data flow diagram tool (DFD) from FigJam to track information as it moves through your process maps and service blueprints.

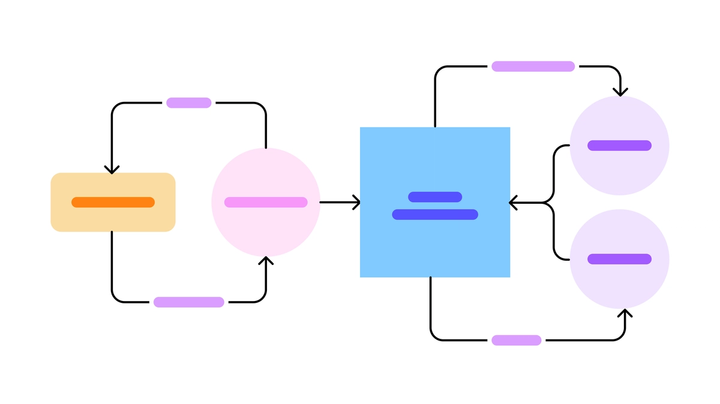
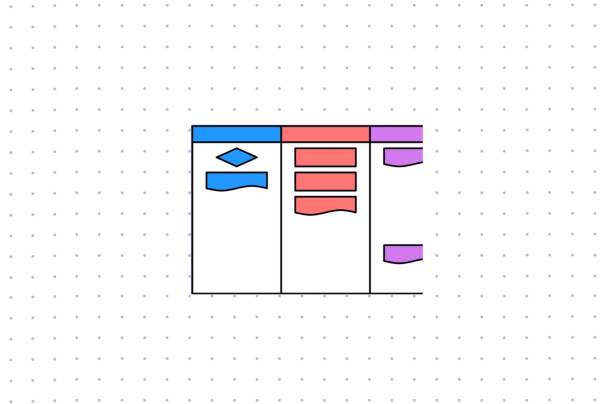
Data flow diagram template
Start with a simple data flow diagram example that works for customer service reps and C-suite execs alike.

Take the flow of data from intangible to intelligible
Chart your plans and processes, identify gaps, and translate tech-speak with our example of data flow diagram.
Make the abstract feel real: Ensure your data is digestible with a visual representation.
Find (and push) the limits: Describe your system’s boundaries in detail—then work to expand them.
Bridge the informational gap: Design a single diagram that technical and non-technical individuals can follow.


FigJam
Data meets drag-and-drop design
Customize our data flow diagram sample to fit your system with out-of-the-box shapes, intuitive connectors, and branded content from your design libraries. Whether your data flows in a trickle or a torrent, see where it winds up with a DFD from FigJam.
Let the insights flow
Gain a valuable understanding of your systems with a sample data flow diagram. Then, improve those systems with more tools from the FigJam community.


FAQs
Data flow diagrams (DFDs for short) outline the way information is transmitted and stored throughout a process. You can think of a DFD as a simplified map that shows the journey of your 1s and 0s.
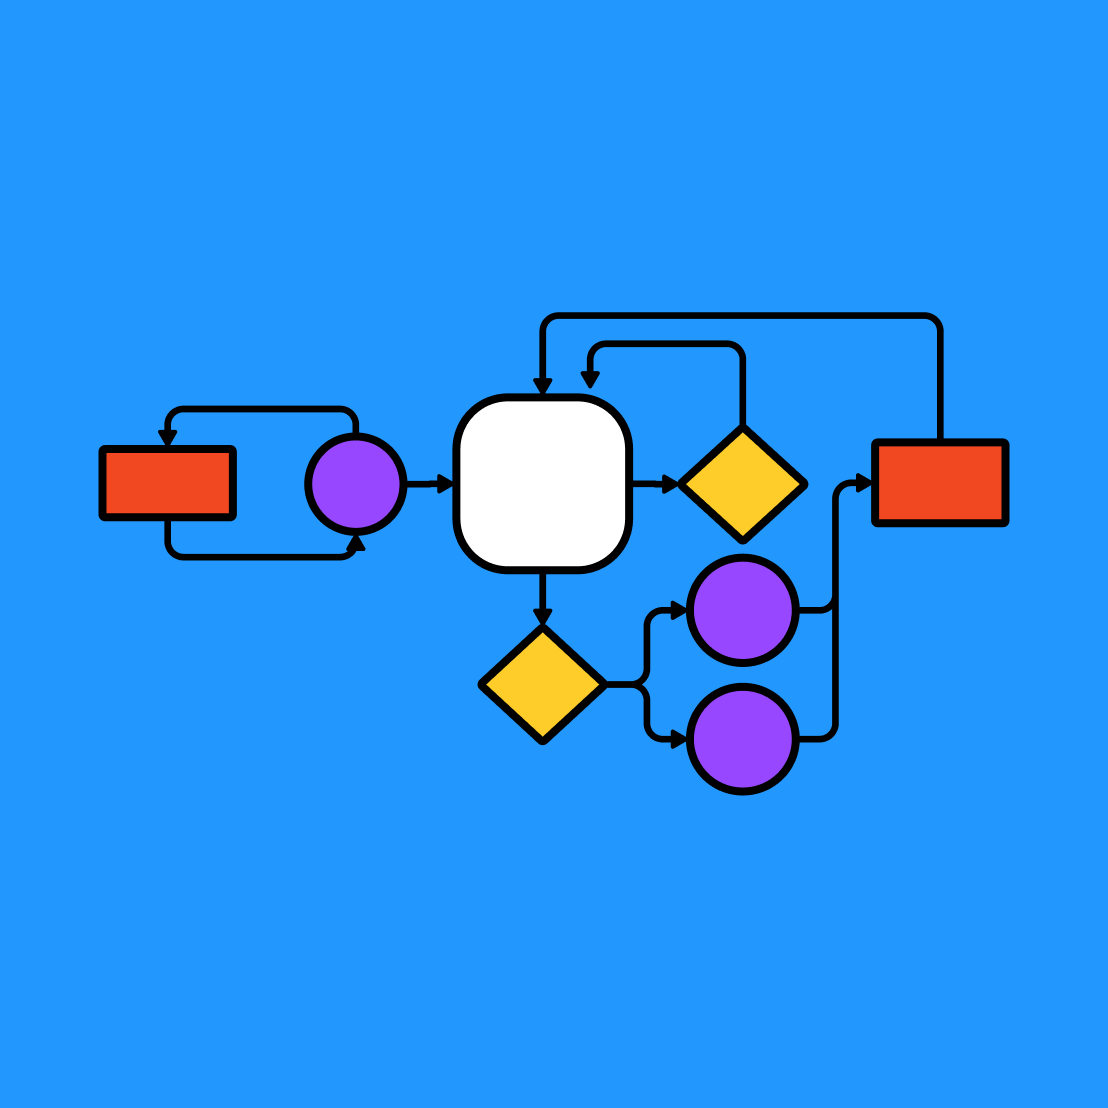
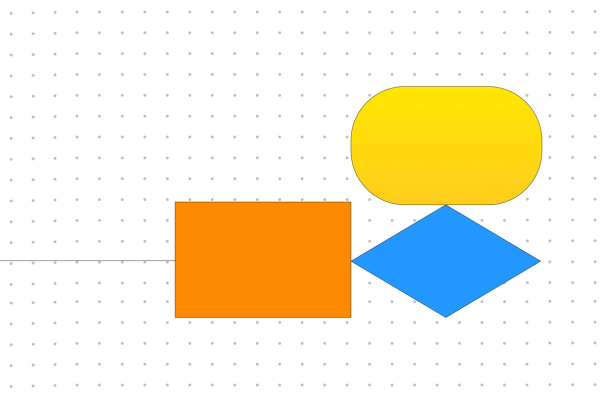
All data flow diagrams rely on a collection of standardized shapes and icons.
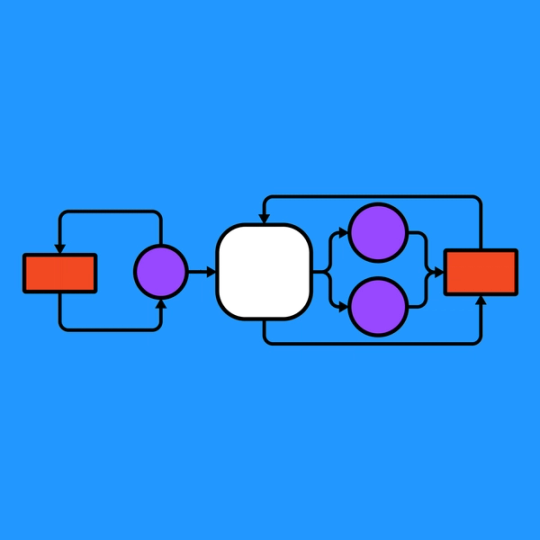
So, what are the symbols used in data flow diagrams? DFDs usually contain rectangles, circles, and arrows, depending on the notation that’s used throughout. There are three common symbol notations that represent the following four concepts:
- External entity – Usually denoted as squares, external entities are the inputs and outputs of a DFD.
- Process – These circle or square containers represent a moment where data is transformed.
- Data flow – The arrows in a DFD symbolize the movement of data throughout the process model.
- Data store – Typically drawn as rectangles, the data store represents data that is held for future use.
When systems become automated or overly complicated, we end up somewhat removed from the process. A data flow diagram takes all of these “behind-the-scenes” happenings and makes them visible again.
Data flow diagram examples are either logical or physical. Logical DFDs show the theoretical movement of information, while physical DFDs show the flow of data in practice by referring to specific hardware and software.
All you need to design a data flow diagram is a blank canvas and a solid understanding of your inputs, outputs, and the single process you’re mapping. Clarity is the name of the game here, so stick to one of the three symbol systems throughout your diagram to ease communication and begin mapping. Once you configure your diagram, you’ll be able to intuit where your processes need improvement.
Ready to refine but don’t know where to start? With FigJam, you can easily see what is data flow diagram with examples. Just customize and collaborate to streamline your DFD—and your systems.
Other templates you might like


Explore 1,000+ templates on the Figma community
Explore even more templates, widgets, and plugins—all built by the Figma community.

