FigJam
Put the pieces together with this DFD level 1 example
Share your system operations in a simple visual format with anyone who needs to understand them. With level 0, level 1, and level 2 data flow diagrams, FigJam makes it easy to visualize the flow of data at every level.

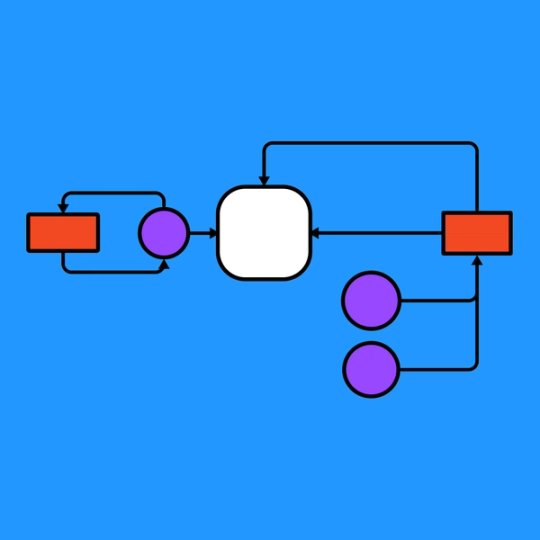
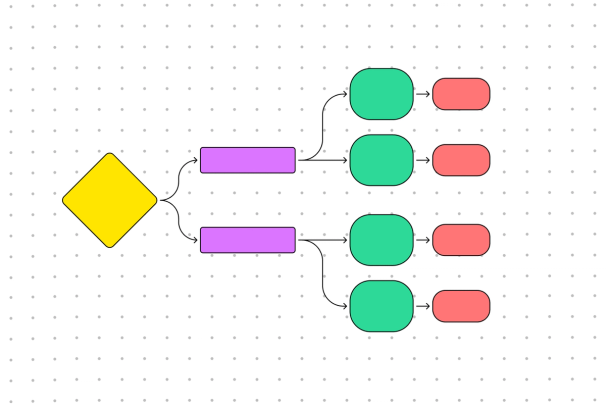
DFD level 1 example
See how every input, output, and process of a system flows together in a format that’s instantly intuitive for data analysts and product teams alike.

Dig into the data, clarify the context
Systems can feel like secret worlds. Shine a light on how they function with a level 1 DFD example that illustrates internal flow.
Establish boundaries: Take a bird’s eye view to see where your system begins and ends.
See what’s there: Establish a clear picture of what your system can already do, then use it to plan for future growth.
Go deeper: Break down a more general context diagram into subprocesses to monitor and learn from.


FigJam
Teach and learn, together
With a clear level 1 data flow diagram, you can share clear technical information across non-technical teams for never ending collaboration. Want to help your entire organization understand how your system works? With FigJam’s integrated widgets, it’s easy to react, dig deep, and turn every remote into a teaching moment.
Work smarter, discover more
Diagramming a complex process doesn’t have to mean hours of tedium. FigJam’s intuitive design templates simplify diagramming, so you can skip ahead to insights.


FAQs
DFD stands for data flow diagram. There are three levels of DFD diagrams—level 0, level 1, and level 2. How do you explain DFD levels 0, 1, and 2? Here’s a quick breakdown of what each diagram involves:
- Level O – Also known as a context diagram, a level 0 DFD provides a wide lens view of an entire system. It outlines the general function of a high-level process so it is clearly comprehensible, even to viewers without technical know-how.
- Level 1 – A level 1 data flow diagram breaks down a context diagram into subprocesses, exploring a process in greater detail.
- Level 2 – So what is 2 level DFD? This detailed diagram delves even deeper into the level 1 subprocesses, specifying individual parts of steps.
A DFD diagram can have as many levels as necessary, but even diagrams for large, complex systems rarely go above level 2.
With FigJam’s powerful and easy-to-use graphics engine, drawing a data flow diagram level 1 becomes fairly simple. It’s a good idea to start by making a context diagram, or level 0 DFD. Once you have an overview of your process, you can break it down into smaller subprocesses and diagram them on FigJam’s level 1 DFD example template.
Level 1 data flow diagrams can provide key insights across many industries and teams but can be especially useful for folks involved in data science, product development, and growth. By effectively breaking down high-level systems into subprocesses, DFD level 1 diagrams can empower technical teams to pinpoint inefficiencies, uncover hidden steps, and highlight areas for improvement—and share their findings across the organization.
Other templates you might like


Explore 1,000+ templates on the Figma community
Explore even more templates, widgets, and plugins—all built by the Figma community.

