FigJam
Think outside the box with our Euler diagram
Whether you’re deconstructing arguments or discovering overlap between groups and ideas, FigJam’s diagramming templates help you clarify existing hierarchies and make creative new connections.

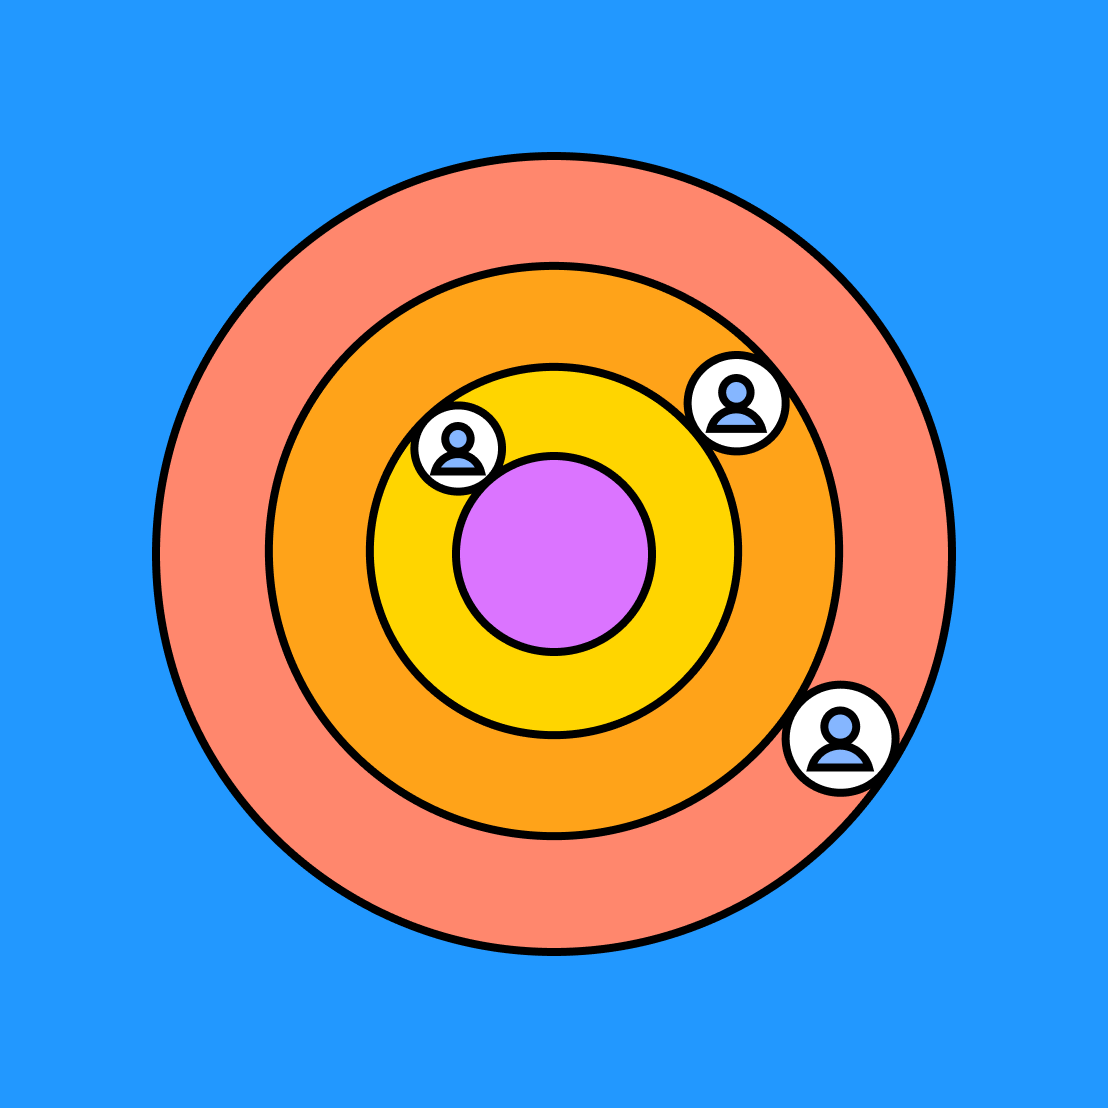
Euler diagram
Distill complicated relationships and systems on an easy-to-understand diagram that’s free to share with your whole circle.
Square the circle with innovative insights
Tackle tough arguments together on a customizable diagram template that illustrates relationships and connections.
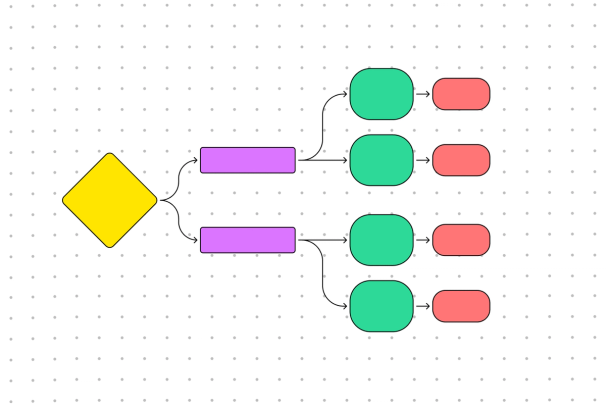
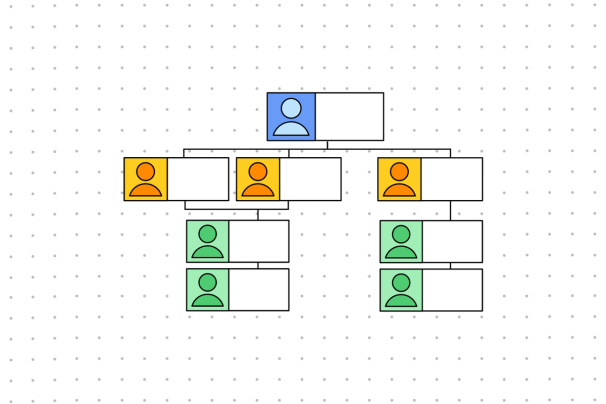
Simplify the process: Capture complex hierarchies with straightforward visual representations designed to be understood at a glance.
Deconstruct your ideas: Delve into the essential components of any argument for a deeper understanding of systems and situations.
Find opportunities: Identify surprising connections between seemingly unrelated groups to expand your insights.


FigJam
Be there or be square
Gather your collaborators and start connecting on our free interactive templates. Sketch out key relationships and hierarchies with our Community-built widgets like Storymapper and react to one another’s ideas with stamps and emotes. With shared workspaces, FigJam templates make it easy for the entire group to circle up and circle back.
Shape up your planning
Establish hierarchies and clarify connections in your next project with our Euler diagram examples. Discover surprising points of overlap at all levels with more templates from our Community.


FAQs
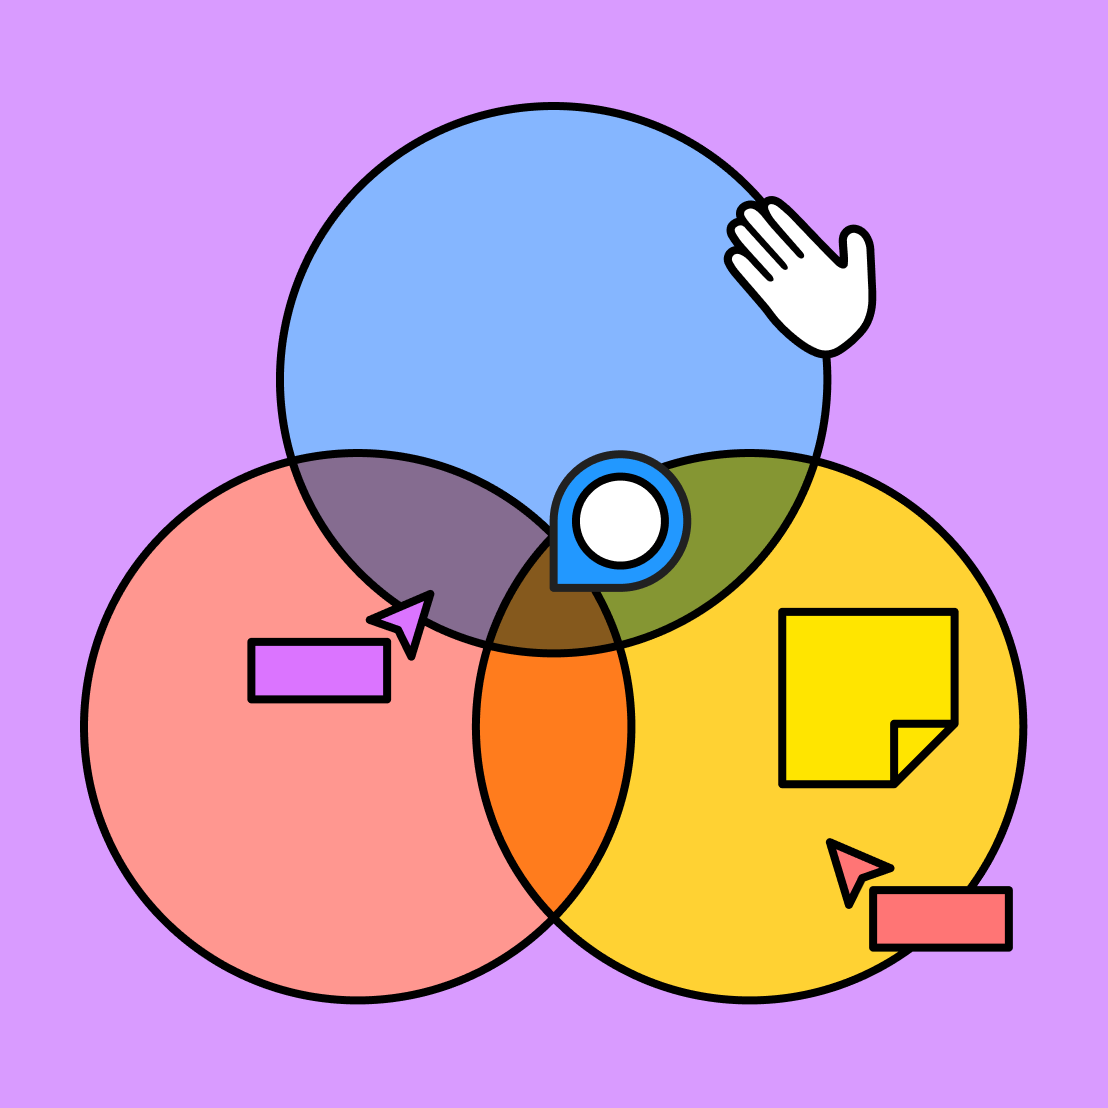
While a Venn diagram conveys all of the possible relationships that two concepts or groups may or may not share, an Euler diagram focuses on various relationships and hierarchies that already exist in the real world.
So which statement can you conclude from the Euler diagram vs. Venn diagram debate? While Venn diagrams can help unpack the potential similarities and differences between two distinct sets, Euler diagram examples can distill a larger volume of information—using reason and logic to show relevant connections.
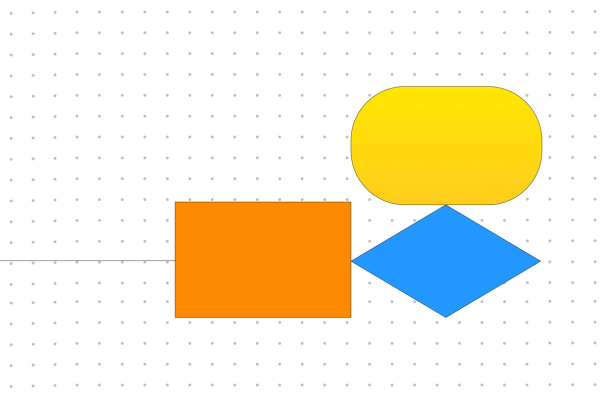
An Euler diagram maps out arguments to show the validity of its different components. Consider the following statements:
- All squares are rectangles.
- All rectangles are parallelograms.
- All circles are ovals.
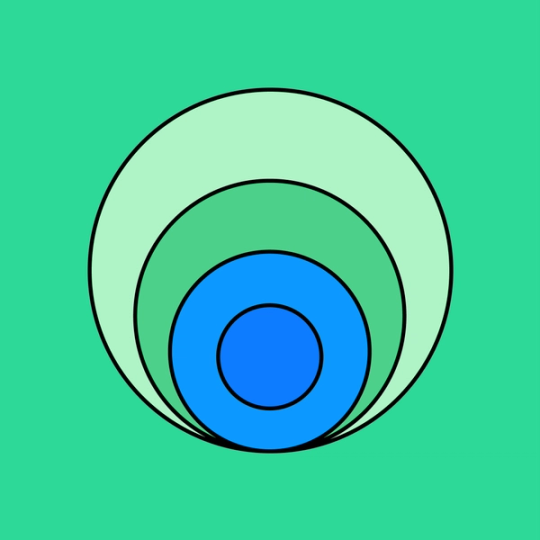
To illustrate these arguments, draw a large circle representing parallelograms, which encapsulates a smaller circle depicting rectangles. Inside the “rectangles'' circle, draw an even smaller circle showing the squares. Separately and unconnected, draw a circle representing the “ovals” category, which encapsulates a smaller circle representing circles. You have then created a visual representation of the various arguments.
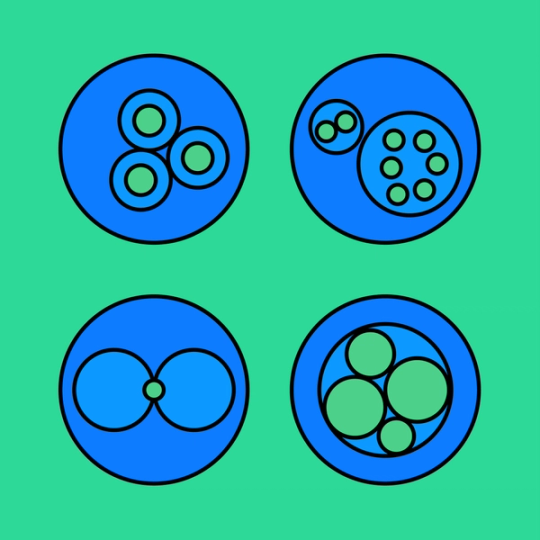
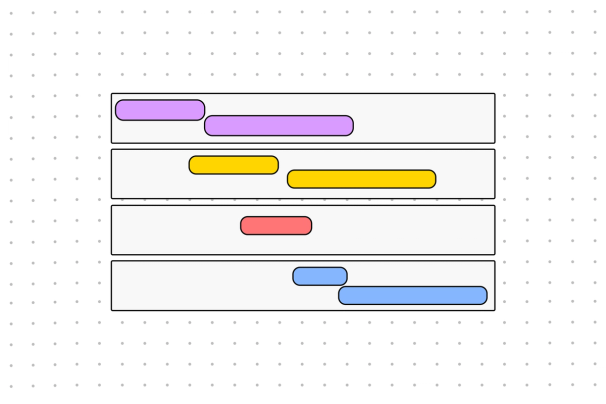
Prep your Euler diagram maker and list out all relevant statements. Then, draw circles according to the following rules:
- If one category is subsumed by another, put the circle representing the former inside the latter.
- If one element has an overlapping subset with another, bring the two circles together until they overlap in the shape of a Venn diagram.
- If there is no connection between the categories, keep the circles separate.
To simplify the process—even with complex relationships at your fingertips—get started with FigJam’s Euler diagram generator. With a customizable, collaborative template in your toolkit, you can communicate arguments, relationships, and priorities to everyone in your org.
Other templates you might like


Explore 1,000+ templates on the Figma community
Explore even more templates, widgets, and plugins—all built by the Figma community.

