FigJam
Visualize your geographic organizational structure
Know exactly where your team members stand—literally and figuratively—with an easy-to-understand visual representation of your internal hierarchy that accounts for each individual’s geographical location.


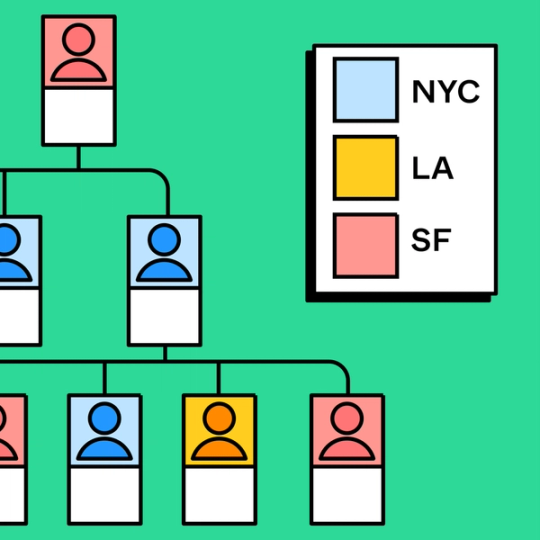
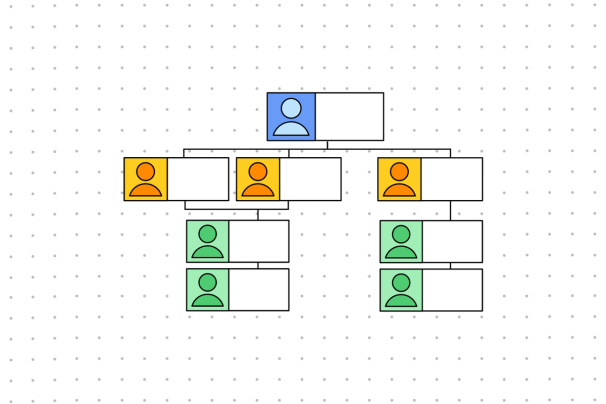
Geographic organizational chart
Make sure your entire team knows who to answer to, who to answer for, and how to get in touch.
Lay the foundation for collaboration
With a visual graphic for a geographical organizational structure, see your company in a whole new light—and build understanding across the board.
Show your stuff: Create a custom chart that is unique to your organization’s distinct structure.
Map it out: Make it easier to understand who is based where with an intuitive layout.
Encourage collaboration: Reveal opportunities for in-person projects by illuminating geographical proximity—or, collaborate with everyone online.


FigJam
Connect from anywhere
Your team members may be far-flung, but your team dynamic is tight. With shared templates, FigJam empowers collaborators to create together from all corners of the world. Innovate your location map with intuitive design tools and integrated widgets like Badge, Bar Chart, and Line Chart to engage your entire org—no matter where they’re logging in from.
Consider every angle
To find success with your organization, it pays to know where everyone’s coming from. With templates from the Community, it’s easy to share insights and source feedback from all corners.


FAQs
Simply put, geographic organizational structures are a chart that depicts both the levels of hierarchy and the physical locations of the members of an organization.
These charts are typically used by businesses that either have several physical locations or that employ many remote workers. By filling in a geographic organizational structure using the chart, company leaders, employees, and contractors can see who is doing what work where (and who could be working better together).
Ageographic division represents the unique sectors of a business or operation identified by specific geographic locations. To understand what informs a business’s location divisions, you may want to ask, “What is the scope of the organization?”
A large paper company might have an organization chart featuring their entire employee hierarchy, with distinguishing colors and/or structures to show their New York City corporate office, their Albany branch, and their Scranton branch.
By contrast, a small, locally-owned chain of restaurants may employ people across multiple locations within one city. They could organize their employees by neighborhood to make sure everyone knows who’s nearby to cover a shift in a pinch.
When you’re thinking about a functional organizational structure, geographic departmentalization (grouping employees by physical location) can be extremely beneficial as it reveals opportunities for in-person project work and team-building.
Creating a chart that shows where your folks work from will allow you to pick out patterns in the organization of your operation and ask important questions. Would it be beneficial to bring a specialized team member into a different location? How many employees will need to fly to the quarterly all-hands?
A geographic organizational chart is also a fantastic reference tool for team members at every level and in different departments. With a shareable chart from FigJam, everyone can get a lay of the land—and map out their next collaborative venture.
Other templates you might like


Explore 1,000+ templates on the Figma community
Explore even more templates, widgets, and plugins—all built by the Figma community.

