FigJam
Problem solve like a superstar with our influence diagram
Make bold decisions that your entire team can follow when you visualize the impact of your actions, whether you’re fixing a broken system, deciding on a new campaign, or considering an organizational overhaul.

Influence diagram template
Explore all outcomes, uncertainties, and possible consequences to arrive at a truly stellar solution, with input from your people.
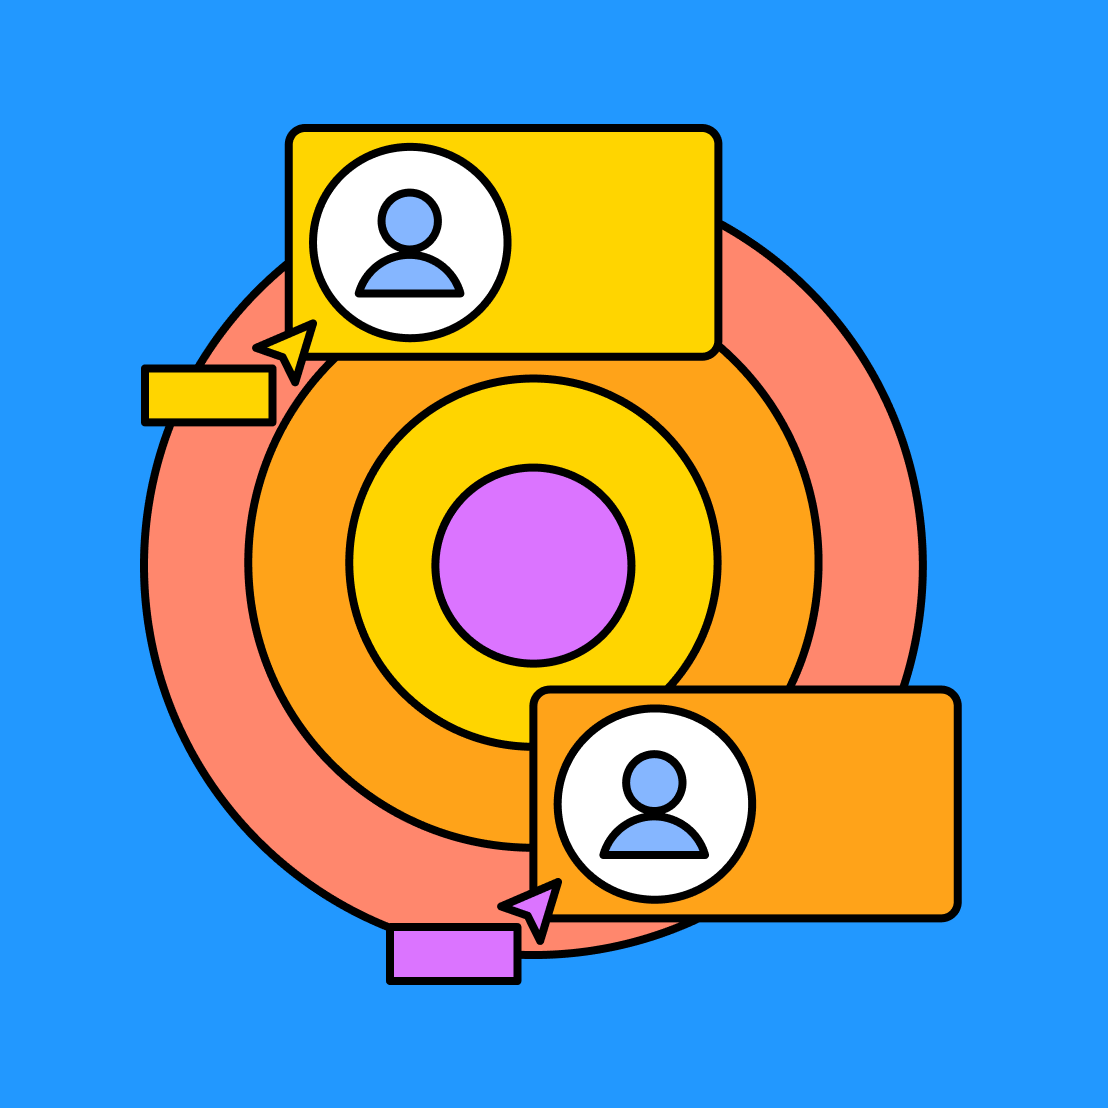
Capture endless possibilities with a single snapshot
In project management, when you’re trying to make an impact, every input matters. Shine a spotlight on all your options, their variables, and their potential outcomes to make decisions with ease.
See your system in high-def: Pinpoint risks and predict resolutions with precision and insight.
Zoom out: Look at a connected overview of your big decision that considers key factors and relationships.
Frame your best options: Rely on interactive visuals designed to help teams form thoughtful decisions.


FigJam
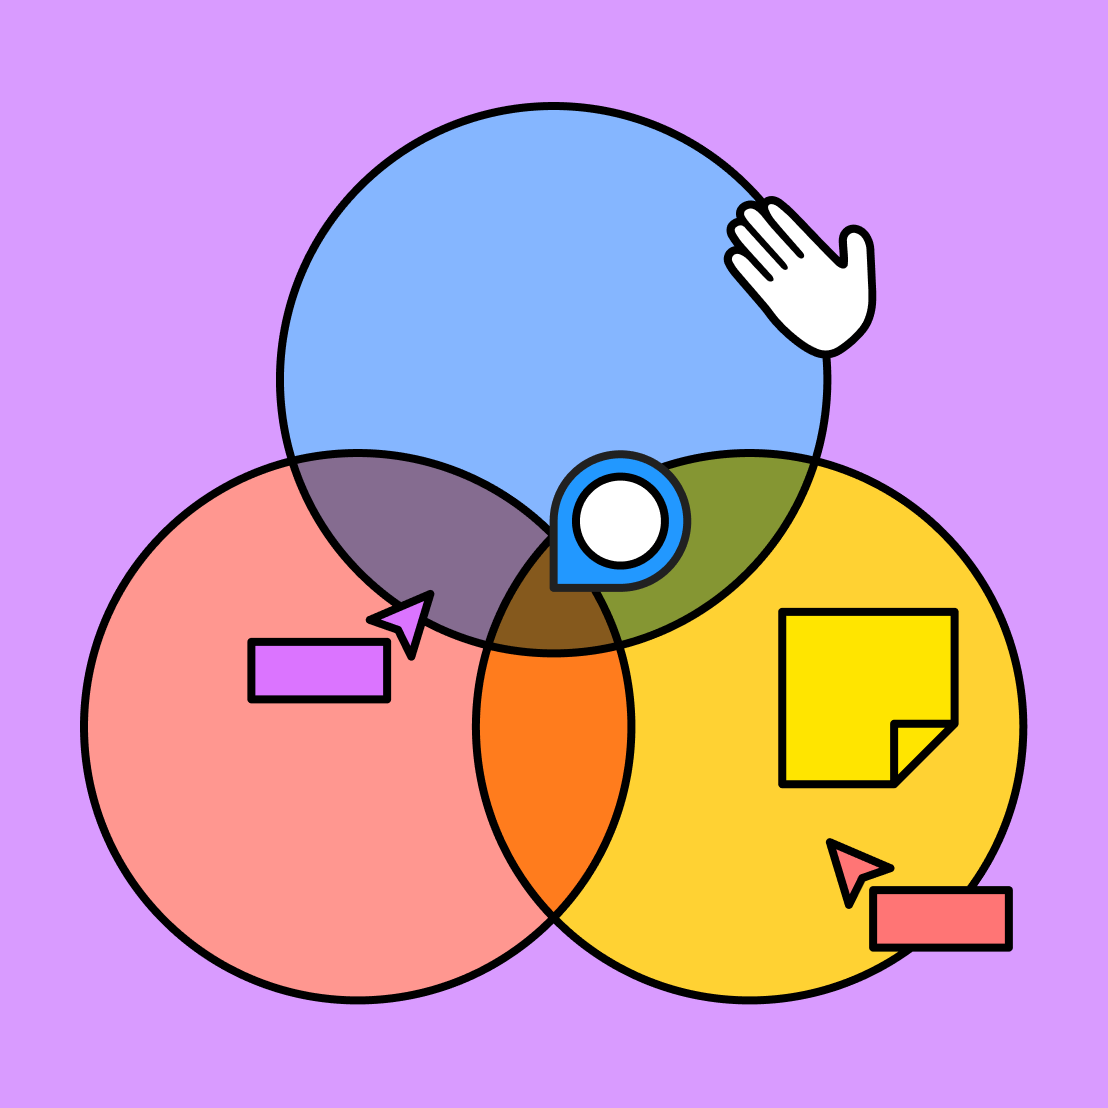
Curate your collective
Every influencer relies on input and inspiration from their peers and idols, just like every good decision requires feedback and insight from the entire team. Share the limelight to make decisions that benefit every member of your squad thanks to FigJam’s shared whiteboards, easy-to-add Badge responses, and endless collaborative features.
Expand your field of view
An overview of your options will help you make smart decisions, but how do you execute on your chosen outcome? Stay engaged with FigJam’s customizable templates, designed to keep your team ahead of the curve.


FAQs
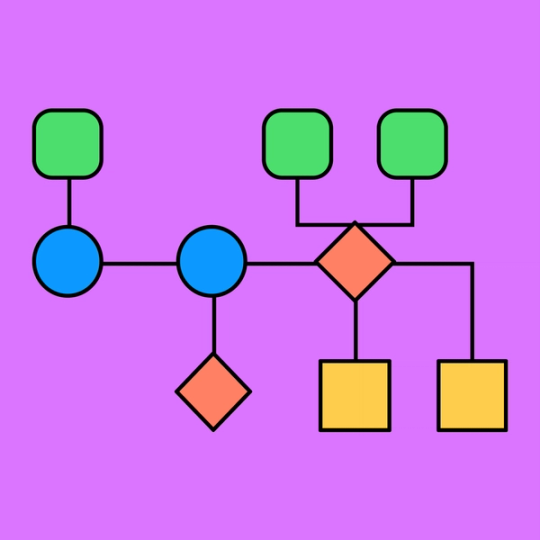
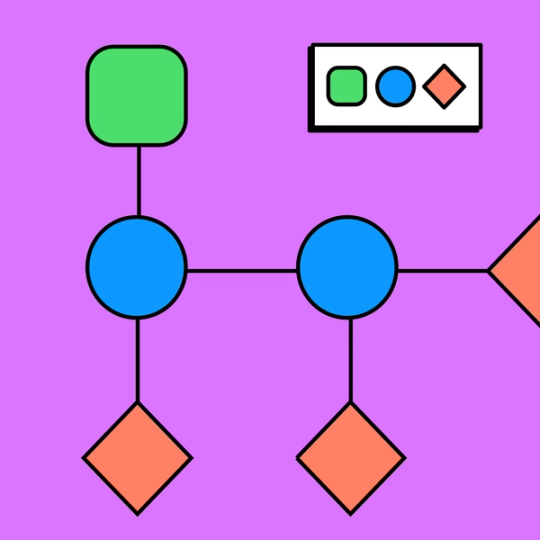
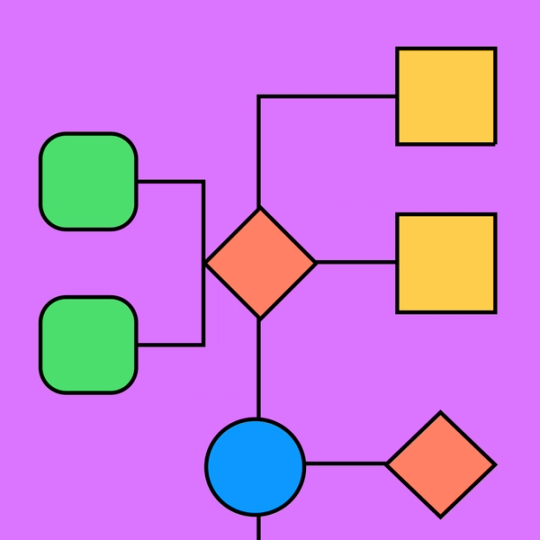
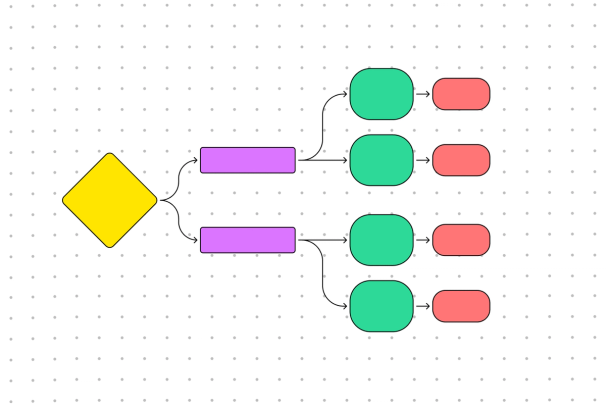
An influence diagram showcases the effect of potential decisions on different elements of your project or problem. This decision analysis includes a series of nodes that represent functions, uncertainties, and values that influence your decision, with connective lines showing the interconnected relationships.
As you brainstorm, you can rely on an influence chart example that captures the full scope of your decision to help predict outcomes, mitigate risks, reduce uncertainty, and manifest intended results.
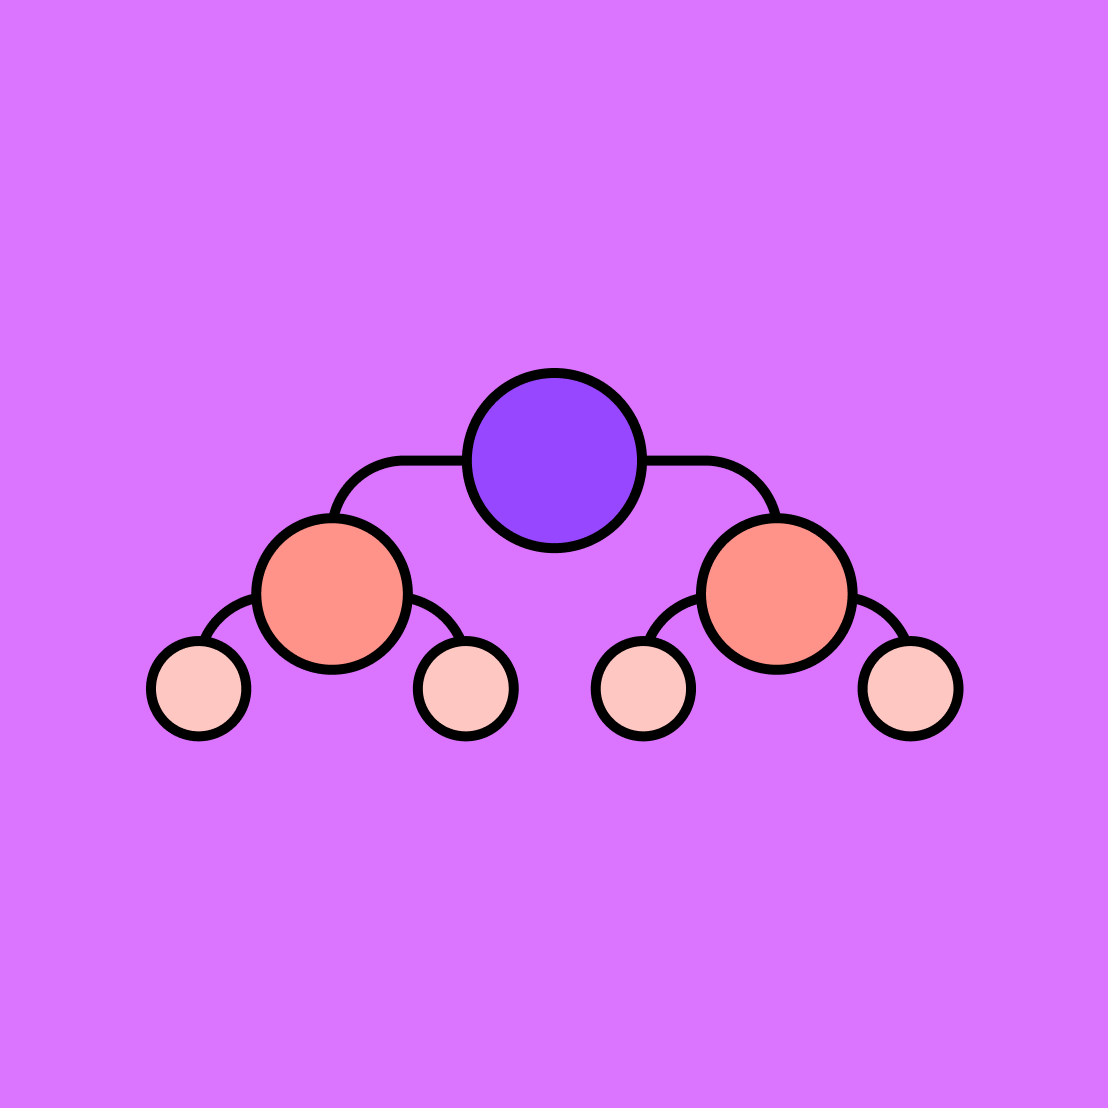
Influence diagrams and decision trees are two useful decision-making diagrams, each with their own pros and cons.
Decision trees depict each possible outcome of a decision, followed by the possible outcomes of each of those decisions, followed by… well, you get the idea. Each tree fork on a decision tree represents a diverging pathway, which can help you choose the best branch to follow.
A compact influence chart example, on the other hand, displays converging paths that depict how each part is influenced by every other part. This provides a big picture overview that accounts for the dependencies between factors, and is often considered a more concise summation compared to detail-intensive decision trees.
A simple influence diagram can be used for just about anything. In the workplace, you might use an influence diagram to weigh the pros and cons of extending a project. Your diagram can help you deduce how schedule changes might impact everything from budgeting and resource allocation to KPIs and department milestones.
Applied to a system, you’ll be able to envision the cascading influence of altered parts. And if you struggle with personal decision-making, an example influence chart might just convince you to post that selfie or launch that business.
Other templates you might like


Explore 1,000+ templates on the Figma community
Explore even more templates, widgets, and plugins—all built by the Figma community.

