FigJam
Kindle connections across families and cultures with a kinship diagram
Track the roles, relationships, and social realities of an entire bloodline—or an entire society—using FigJam’s interactive kinship diagrams and family trees.

Kinship diagram template
Connect with your partners and your participants on a collaborative kinship diagram maker.
Connect the dots of the dynasty
Record relationships, write about weddings, and dive deeper into the archives of any culture or familial lineages (including your own).
Untangle complex webs: Navigate knotty relationships—no matter how many times “removed” your cousin is.
Visualize vows: Determine who’s married to whom (and who’s a product of which marriage).
Perform meta-analysis: Learn about cultural and societal traditions through the lens of a kinship chart.


FigJam
Make it a family affair
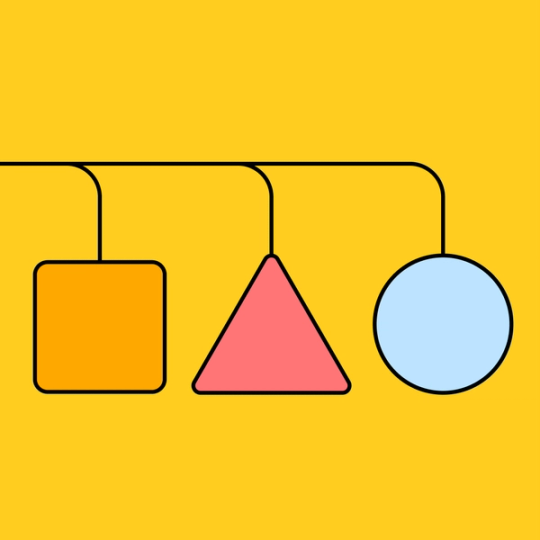
Build out your kinship diagram with kindred spirits in an intuitive, interactive environment. Graph out genealogy with ready-made shapes and connectors that snap to the grid, then elevate your chart together with Timeline and Storymapper.
The more the merrier
Curate a list of relatives to figure out the family relationship. Next, dive into more templates from FigJam’s extended family.


FAQs
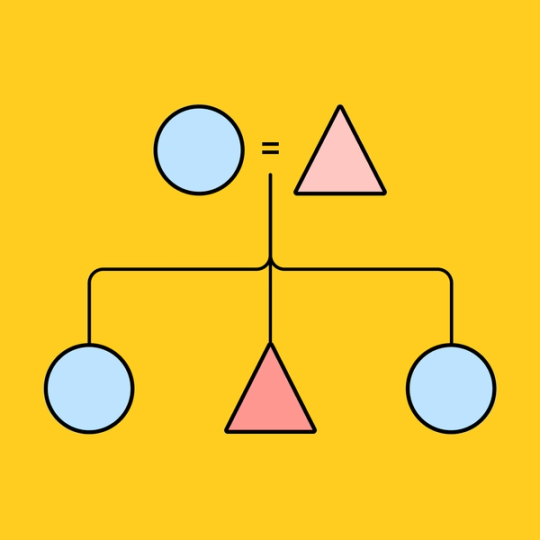
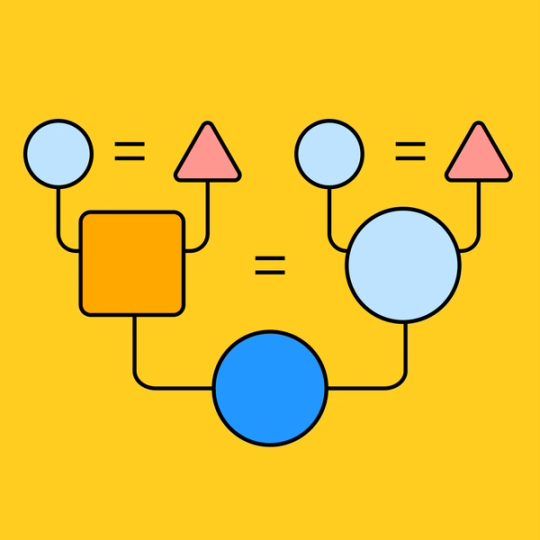
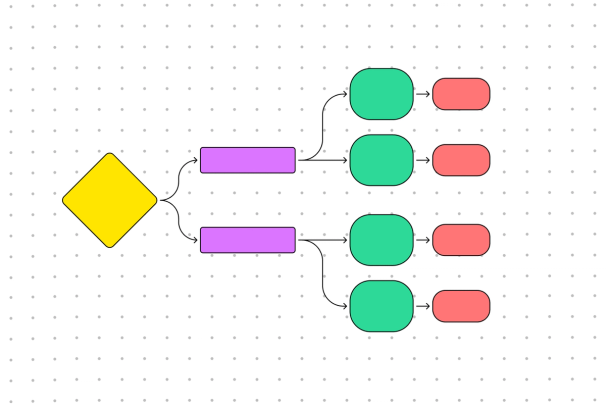
A kinship diagram is a graphic organizer that showcases familial ties. At a glance, it’s a collection of boxes connected by lines. On closer look, you’ll see that each box represents a family member, and the horizontal and vertical lines convey the relationship between each member.
Like a family tree, a kinship diagram example provides a visualization of ancestry. While kinship charts can be used to illuminate lineage in any application, they’re often used by professional genealogists or anthropologists when conducting fieldwork.
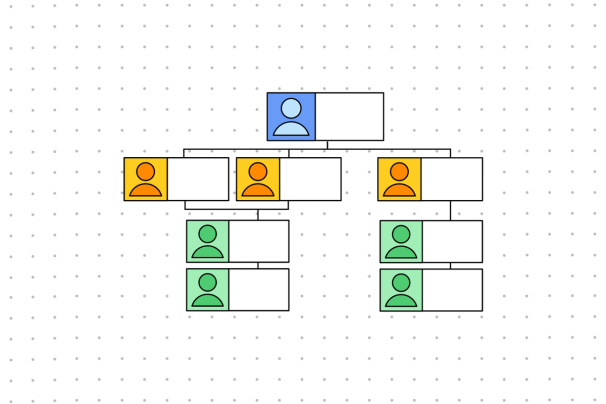
To make a kinship diagram, you’ll begin by creating a list of family members. Next, you’ll decide on a set of kinship symbols and colors that denote gender and generation and create a legend that explains your symbols. For example, you might use circles to represent women or use squares when gender is unspecified.
Once you’ve devised a visual code, it’s time to connect the dots. Most kinship charts start with the most recent generations at the bottom and extend upward as they travel back in time. Using connectors between each name, you can clearly demonstrate the relationship between each person.
Whether you’re creating a kinship diagram for your family or completing a complex anthropological study, one thing is for sure: your kinship diagram relies on people. To gather necessary info, you’ll have to talk to the matriarchs, patriarchs, and memoir-keepers.
The best informant interviews are in-person. But in our crazy busy world, it can be tough to land in-person meetings with your subjects (even when you share the same parents).
With an online kinship chart maker from FigJam, you can meet your interviewees on their time, wherever they are. Anyone involved in your kinship diagram can add comments, drag in photos, and even play games together—all from the comfort of their web browser.
Other templates you might like


Explore 1,000+ templates on the Figma community
Explore even more templates, widgets, and plugins—all built by the Figma community.

