FigJam
Trace your family lineage with a pedigree chart example
From recessive hair color to family members’ specific genetic traits, this customizable diagram reveals each leaf, branch, and ring in your family tree.

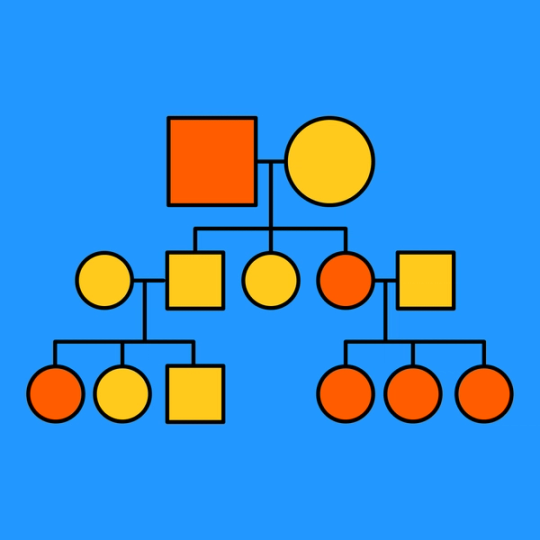
Pedigree chart example
Visualize the relationship between family members dating back generations and use genotyping to determine inherited traits with this tree-shaped diagram.
Someone said you look like great-aunt Betty
Discover the science behind familial resemblance and predict health risks with a pedigree map. Bring it to the next reunion and prove you’re actually more like great-aunt Margaret.
Know your roots: Map out which family members are responsible for particular genetic traits.
Count the rings: Get familiar with long-gone ancestors while you trace your family history.
Branch out: Understand how diseases pass down through generations.


FigJam
This chart was made for sharing
Just like FigJam’s free, interactive templates, your genetic pedigree chart is best experienced together. Whether you’re dissecting traits with family via Lil Notes or reacting to revelations with Emoji, bring your closest kin a little bit closer.
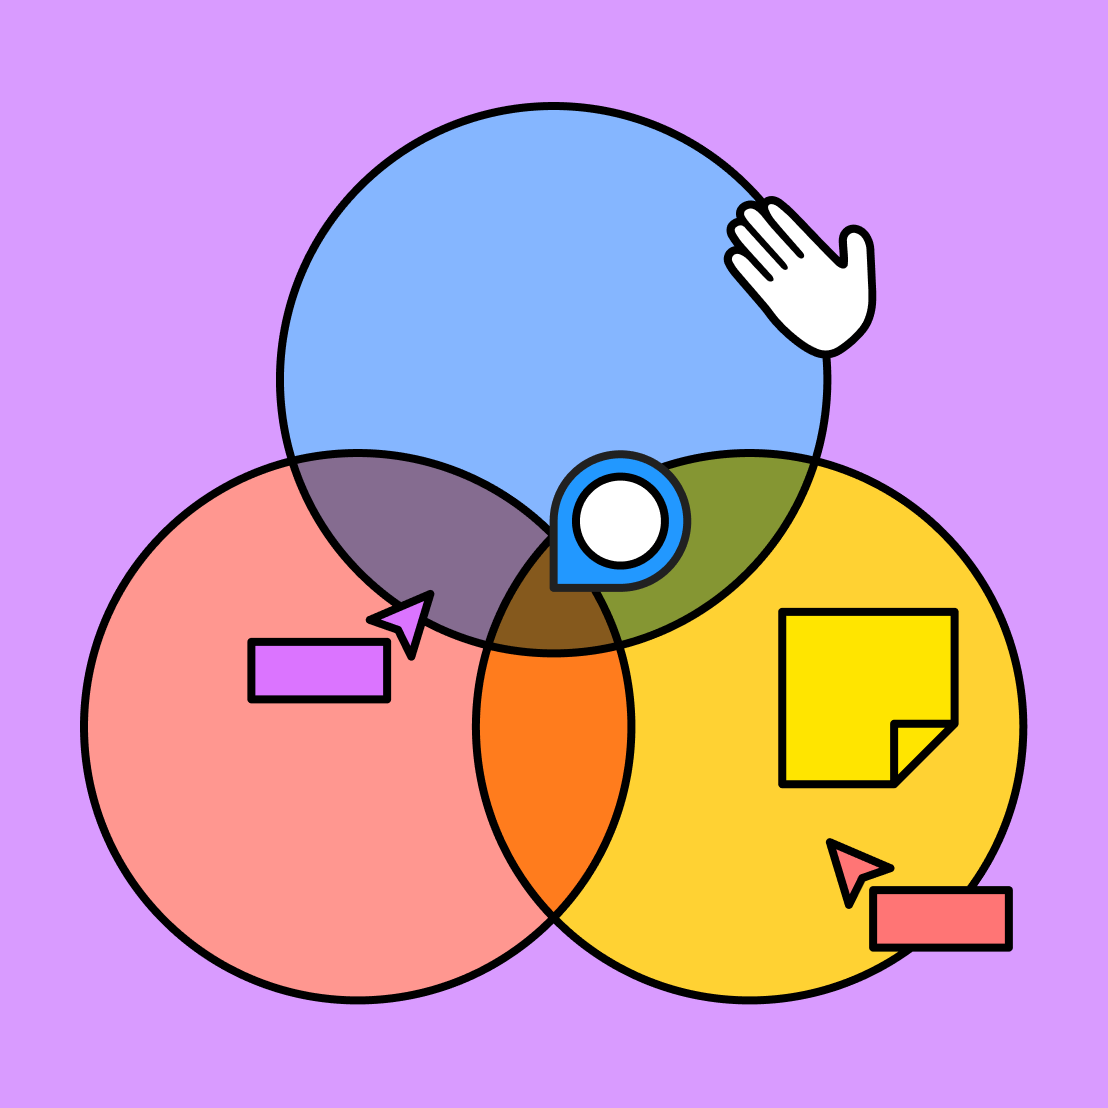
Our templates share one trait in common
It turns out that with FigJam’s free resources, “fun” isn’t a recessive gene. Discover this remarkable trait in all of our Community templates.


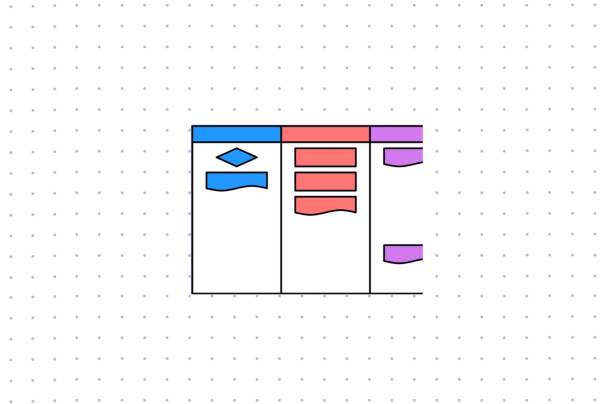
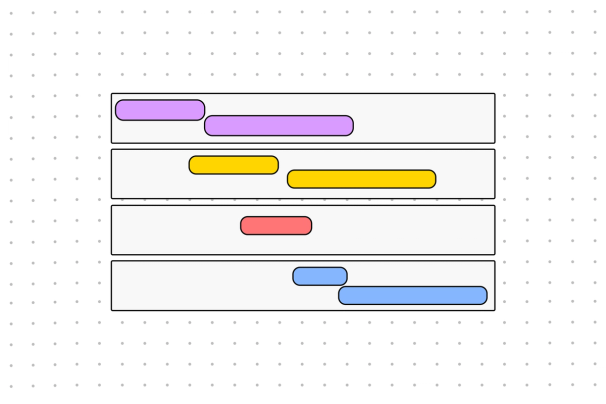
Future plan template
Unpack your goals and daydream up headlines with this ambitious strategic chart.


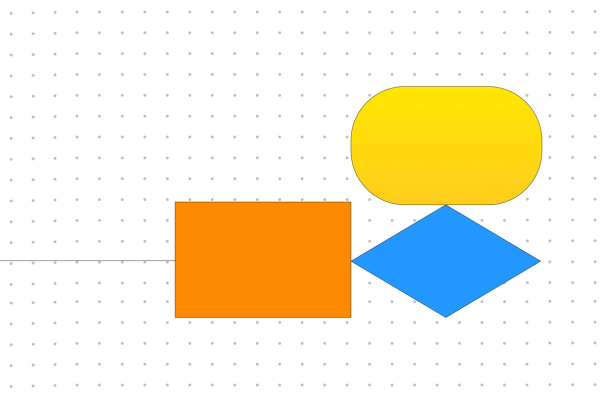
Strategy diamond
Build an effective and unified business strategy with this visual diagram.

Other templates from the community
Like a mighty forest, our templates form a diverse sanctuary for lush productivity.
FAQs
A pedigree chart visually depicts the genetic relationships between family members across generations. You might use a pedigree chart maker to trace recessive and dominant features like eye color and height or identify which family members are carriers of diseases for a comprehensive analysis of susceptible descendants. By following the descending shape of tree roots interconnected by branching lines between generations, you can see a clear image of your family’s genetic history.
Are you looking to trace the pathways of traits passed down through your family? Are you fleshing out your understanding of another culture or community? Discover how to create pedigree charts by downloading FigJam’s free pedigree example chart.
This customizable, interactive template allows you to easily plug in family members’ names, ages or lifespans, and specific traits. Brush up on family knowledge ahead of time to be sure you include all pertinent information for an accurate representation.
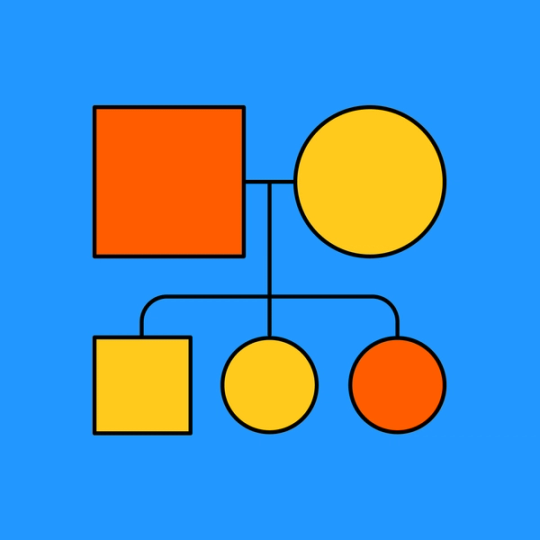
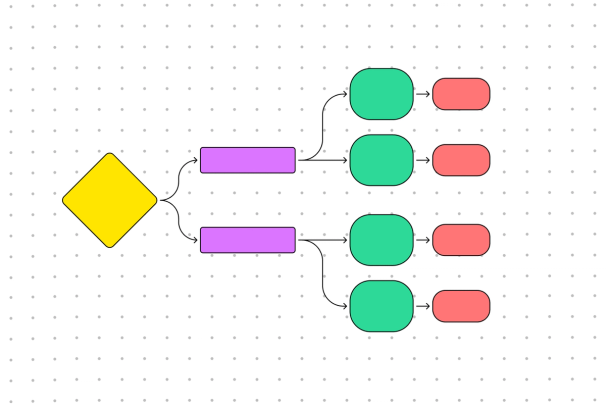
Your free pedigree template features individual nodules for each family member, connected by lines to show their ancestors and descendants. Organize each descending level by generation and list yourself—or your subject—at the bottom.
A genetic trait chart is deceptively simple to read thanks to its familiar tree-like shape and traceable branches. Start at the top, where you’ll find the oldest generation or your original ancestor. From this nodule, you can follow connecting lines down to the next generation. Lines that travel horizontally indicate the relationship between parents, and lines pointing downward show their offspring.
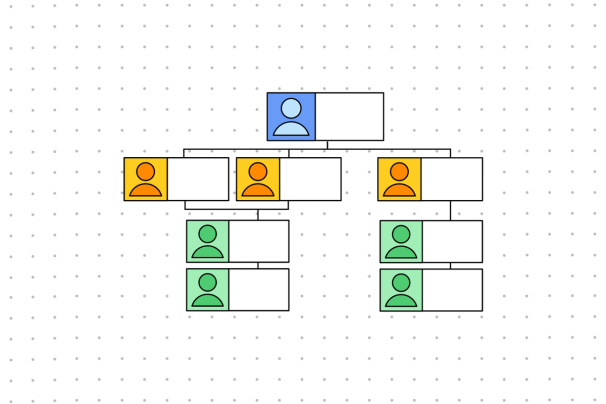
This genetic family tree continues down through generations until it reaches your name at the bottom. From the bottom up, you can trace your identified traits or track diseases up through generational levels until you reach their origins. Your analysis will reveal where certain traits began and who in your family might carry them.
Other templates you might like


Explore 1,000+ templates on the Figma community
Explore even more templates, widgets, and plugins—all built by the Figma community.

