FigJam
Contrast to compete with a product comparison template
Give users and team members an easy way to compare and contrast your products and services. FigJam’s product comparison tool is here to help.

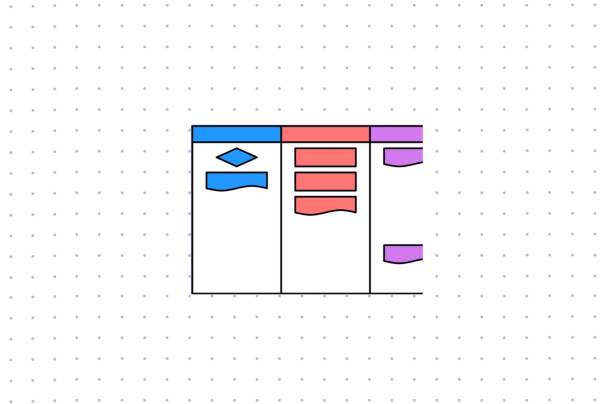
Product comparison template
See—and show off—how your product stacks up with a customizable comparison table.

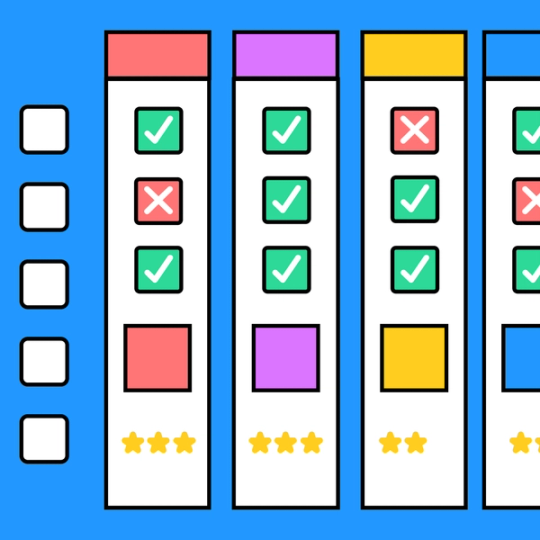
Give it everything you’ve got
Create efficient experiences end to end with a product comparison table template that gives your team—and your users—a clear view of your value.
Lay it out: Offer an intuitive means of product comparison to all your stakeholders.
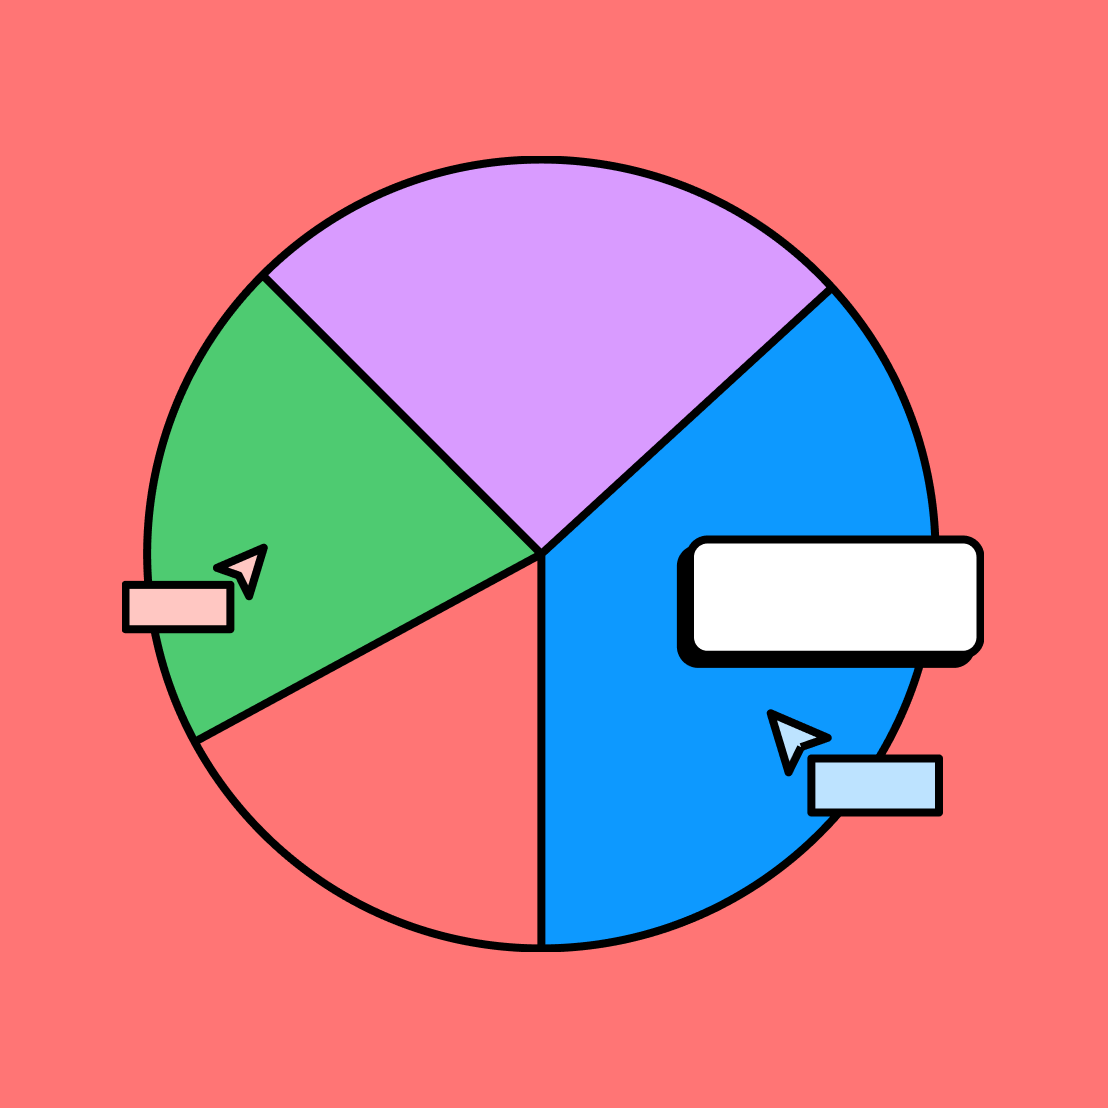
See it clearly: Gain insightful knowledge about your products’ comparison points.
Track and change: Understand user pain points and identify product features that need tweaking.


FigJam
All together now
Teamwork is the best way to figure out how to frame your products. FigJam’s product feature comparison template is more than a fillable chart—it’s a digital meeting space where you and your team can come together, no matter where you are, to innovate your creations. With integrated feedback widgets like Lil Notes and emotes, cooperation has never been easier.
Put it down on (digital) paper
Compare, contrast, and collaborate on customizable product comparison examples. Then, keep on designing standout products with templates from the Community.


FAQs
Product comparison is the practice of comparing and contrasting the features and designof multiple products. It’s performed across many industries—both by consumers and by businesses.
Consumers use product comparison charts to quickly assess the value of a product as it stands in the market—which features it offers, how much it costs, and how it compares to a competitive service or good. Businesses use product comparison exercises both internally (to strategize messaging and product development) and externally (to communicate a product’s benefits to users).
First, determine which type of analysis you’ll be performing.
If you’re assessing your organization’s products against one another gather your team, the specs of your products, and FigJam’s product comparison table template. Organize your product information in a way that makes sense for your stakeholders (and that looks sharp, too).
If you’re performing a product comparison for competitor analysis, you’ll need to do some information gathering. Once you have reliable research on competitors' similar products, you can bring up the FigJam product comparison chart template and plug in your data. The resulting chart should provide you with useful insight into where your product stands amidst the pack.
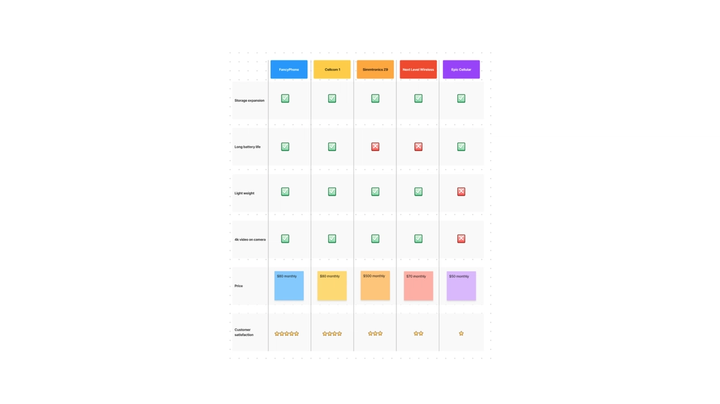
Filling out a product feature comparison template is simple, as long as you have the relevant product information on hand. Determine the features that you’d like to compare, then list them opposite each model of your product. Populate the chart with your data—perhaps using checkmarks or symbols to signify whether a product does or does not include a certain feature—and you’ve got a useful assessment and marketing tool.
You can create product comparison charts that feature several competitors, but these tools can also be effective as a means of comparing and contrasting just two similar products—this or that. So how do you make a comparison between two products? The same rules apply. Simply identify the features that you would like to compare and fill in the chart to reflect the specs.
Other templates you might like


Explore 1,000+ templates on the Figma community
Explore even more templates, widgets, and plugins—all built by the Figma community.

