FigJam
The price is right with a supply and demand graph
You have it. They want it. Perfect your pricing with FigJam’s supply and demand diagram maker, and never wonder if you’re overcharging or undercharging again.

Supply and demand graph
Ensure everyone in your organization understands the market price surrounding your products and services with our supply and demand chart maker.

Project a positive plan
Stay ahead of tricky market turns by understanding where your product fits into the grand scheme of things and plan your price points from an educated POV.
Plan ahead: Predict the market trends for your product, and adapt nimbly as the landscape changes.
Improve your products: Specify the unique value your organization can offer, and collaborate more efficiently to create it.
Poise for profit: Designate concrete profit goals backed up by data.


FigJam
This little Figgy went to market
FigJam’s supply and demand curve maker and take each team member’s talent to market. With intuitive design tools that make graphing a breeze and integrated widgets like Anonymous Thoughts, Lil Notes, and Simple Vote, innovating as a team has never been easier.
Demand better diagrams, supply better results
Take all of the relevant info into consideration when you graph your different priceson a supply and demand chart. Then, check out FigJam’s Community templates to make an impact on the market.


FAQs
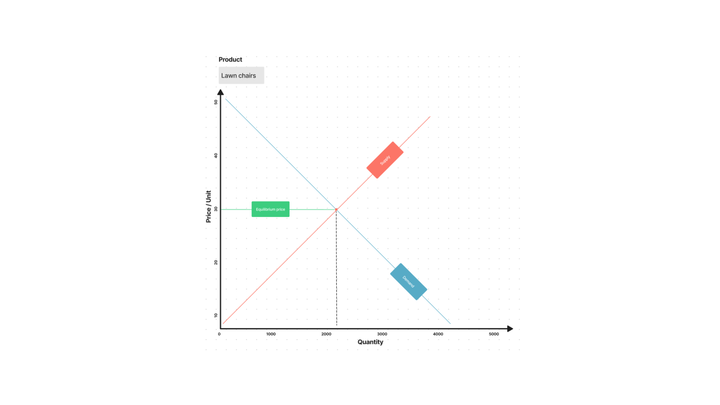
To create a supply and demand graph, organize your market and product data on a spreadsheet and then graph it on two axes—an x-axis representing the quantity of product available and a y-axis representing the price per unit of product.
Then, draw your curves according to the placement of your data points. You will sketch a demand curve (how many units of product a consumer will buy at what price) and a supply curve (how many units are available at a given time).
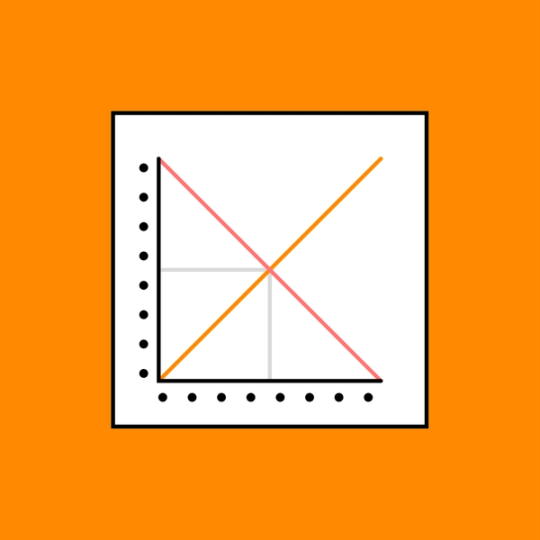
If you’re wondering how to read a supply and demand graph you’ve created, rest assured that it’s fairly simple. The sloping supply and demand lines will inevitably intersect to reveal the price that will maintain a profitable and balanced relationship between supply and demand.
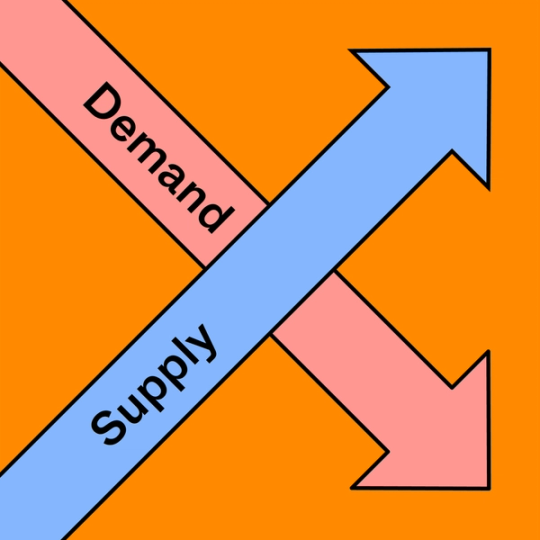
The two curves on your supply and demand curve graph reveal the relationship between a product’s price and its availability on the market.
- The supply curve represents the number of products that your company can “supply” to the market during a given period.
- The demand curve communicates how many products or services a target consumer is willing to purchase at a given price point.
- The intersection of the supply and demand curves determines the “equilibrium point”—the price that will keep supply and demand in balance.
Ready to draw your supply and demand graph and determine your product’s ideal pricing? Get started with FigJam’s free supply and demand diagram maker.
There are four key factors to consider when thinking about supply and demand are:
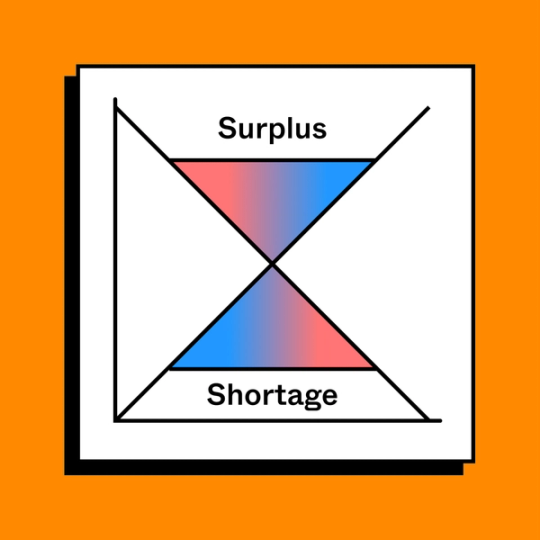
1. As price increases, supply increases.
2. As price increases, demand decreases.
3. The interaction of these two phenomena determines the market price and quantity.
4. Outside influences can impact can supply and demand, thereby upsetting the market equilibrium.
Other templates you might like


Explore 1,000+ templates on the Figma community
Explore even more templates, widgets, and plugins—all built by the Figma community.

