FigJam
Say it with an infographic example
Jazz up dry data, summarize a boring annual report, and inspire engagement with your weekly email briefs using a creative infographic example from FigJam.

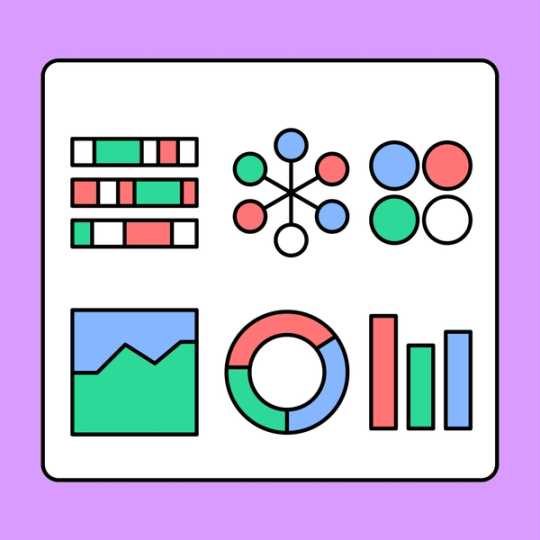
Infographic example
Connect and collaborate over a visually appealing infographic template to spruce up any and all communications.

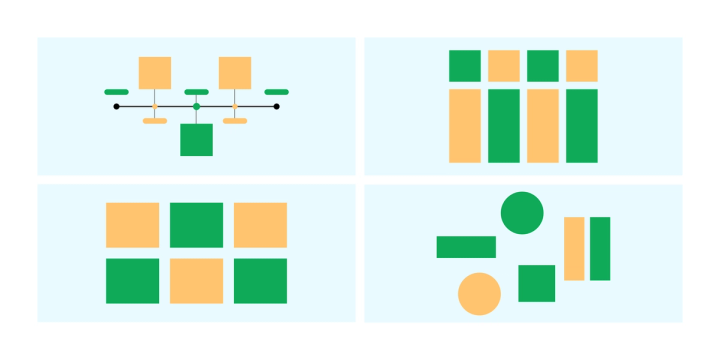
Infographic example designs—a launchpad for innovative ideas
Make intricate data sets, complicated lectures, and multi-pronged policies intuitive with customizable infographic templates.
Calling all visual learners: Distill complex concepts or number sets into an easily digestible infographic design.
From info to inspo: Deliver data and deets through engaging displays that better tell your story through data visualization.
Stop the mindless scroll: Captivate audiences on social media with well-crafted infographics and visual designs.


FigJam
Combine, consolidate, and cooperate
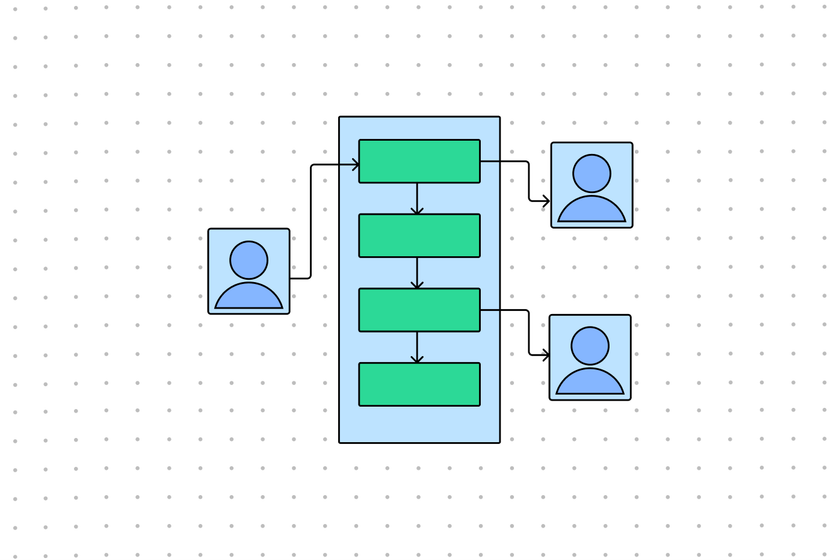
Everybody’s input is welcome when creating an infographic example design. Ask teammates for visual input and suggestions using emotes, cursor chats, and stamps, or invite them to contribute directly to the expansive shared whiteboard.
Not to be graphic, but…
There’s a lot you can do with an example infographic—let your creative juices flow! No graphic design experience needed. While you’re in the zone, explore other creative and functional Community-built templates.


FAQs
An infographic highlights key data and talking points through visualization. Want to downsize a student study guide? Distill a financial report into a couple important takeaways? Explain a complicated workplace policy? Our infographic template will help you do just that. With colors and shapes that add emphasis and clarity, an infographic can help you share critical messages without putting your team to sleep. Often a visual representation is what you need to clear up confusion or get your point across more efficiently.
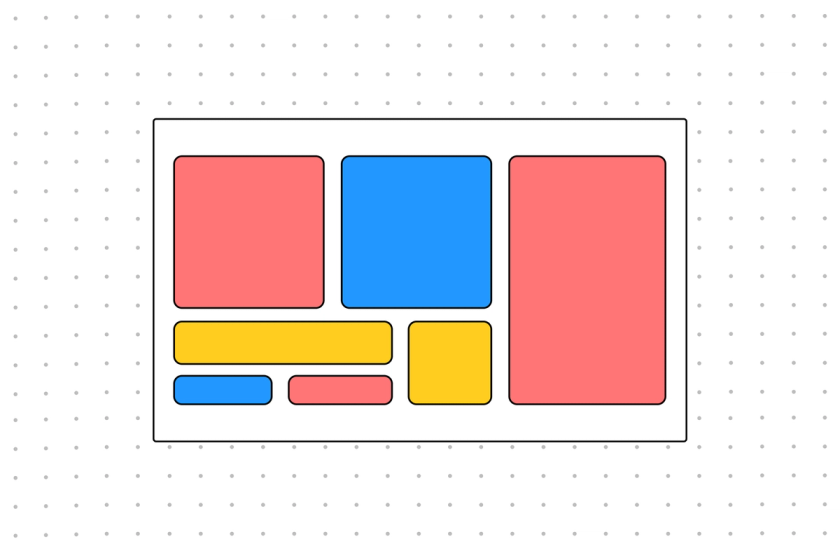
The best infographics live up to both parts of their name. They’re informative and aesthetically pleasing, accurately conveying complex information with just the right amount of visual interest. Use infographic icons and other visual content to help get your point across. Incorporate a variety of visuals such as bright colors, a chart, or other illustration.
Try to keep your infographic clean and clear, focus on your users’ experience—using colors, shapes, and charts to deepen understanding of facts and data, rather than distract. To that end, you may want to try and keep you text minimal. If you want to get further in-depth, you can always direct readers to resources or further reading.
Wondering about how to cite sources on an infographic? You can tag accounts, add hyperlinks, or incorporate footnotes into your infographic as needed (just make sure you don’t clutter your creation).
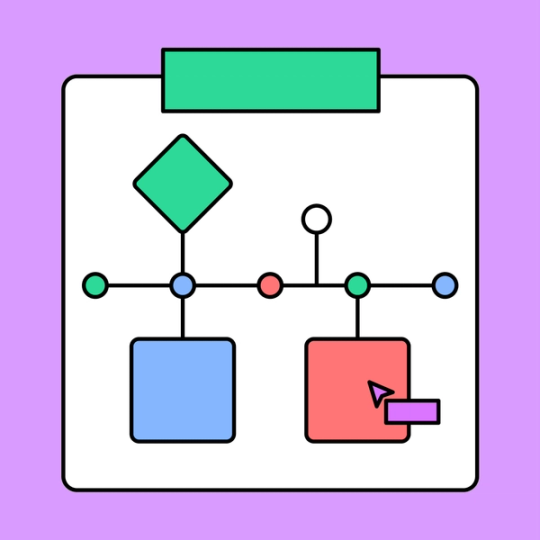
What you include in your infographic will depend on the information that you’re trying to get across. But whether you’re breaking down some complicated bylaws or unpacking bias in the medical field, or developing an infographic resume, you’ll likely fold in some common infographic elements like diagrams, data visualizations, icons, and tables.
Need some inspiration? FigJam’s infographic example designs can be a helpful jumping-off point. Just open our free example of an infographic design template and then go wild. Customize, refine, and share your creation with your team—and then the world. Get started on your amazing infographic!
Other templates you might like


Explore 1,000+ templates on the Figma community
Explore even more templates, widgets, and plugins—all built by the Figma community.

