FigJam
Level up your level 2 data flow diagram with a customizable template
When you need more from your data flow diagram or process map, our level 2 data flow diagram (DFD) displays every nitty-gritty detail within your information system in high definition.

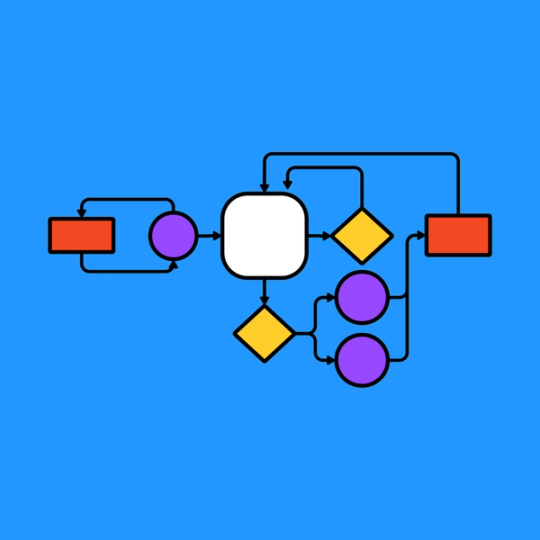
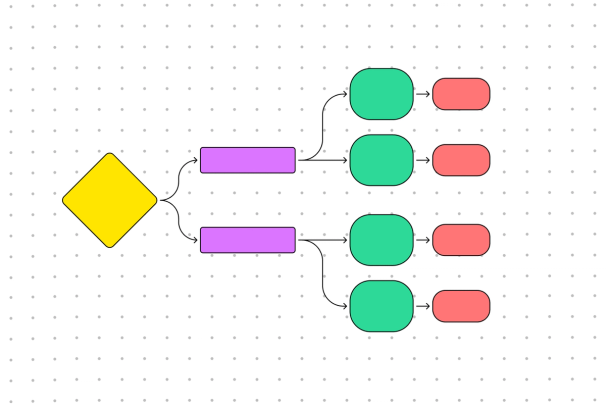
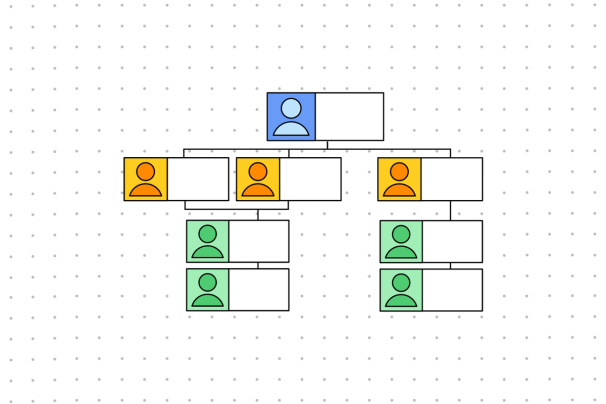
Level 2 data flow diagram template
From engineers to executives, anyone in your organization can grasp the most complex processes with our level 2 DFD example.
Get to know your systems on another level
Drill down and map out every single process in incredible detail with your own level 2 DFD diagram.
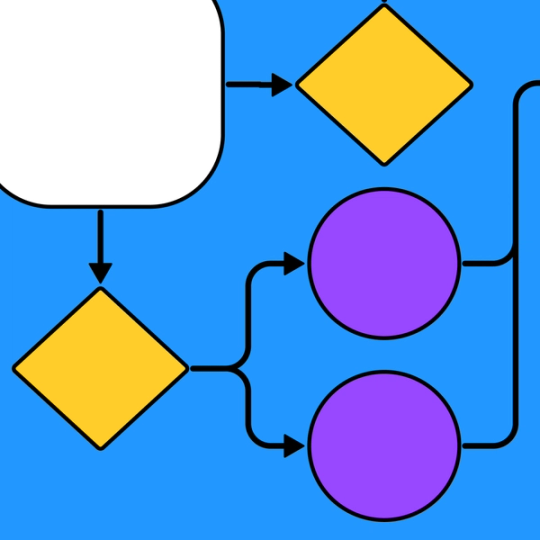
Zoom in on each step: Scrutinize every part of the process by identifying layer upon layer of sub-processes during the systems analysis.
See the big picture: Visualize your entire system through one extensive diagram.
Make your data make sense: Create and share a structured analysis in a format that all team members and stakeholders can understand.


FigJam
Become a data flow pro
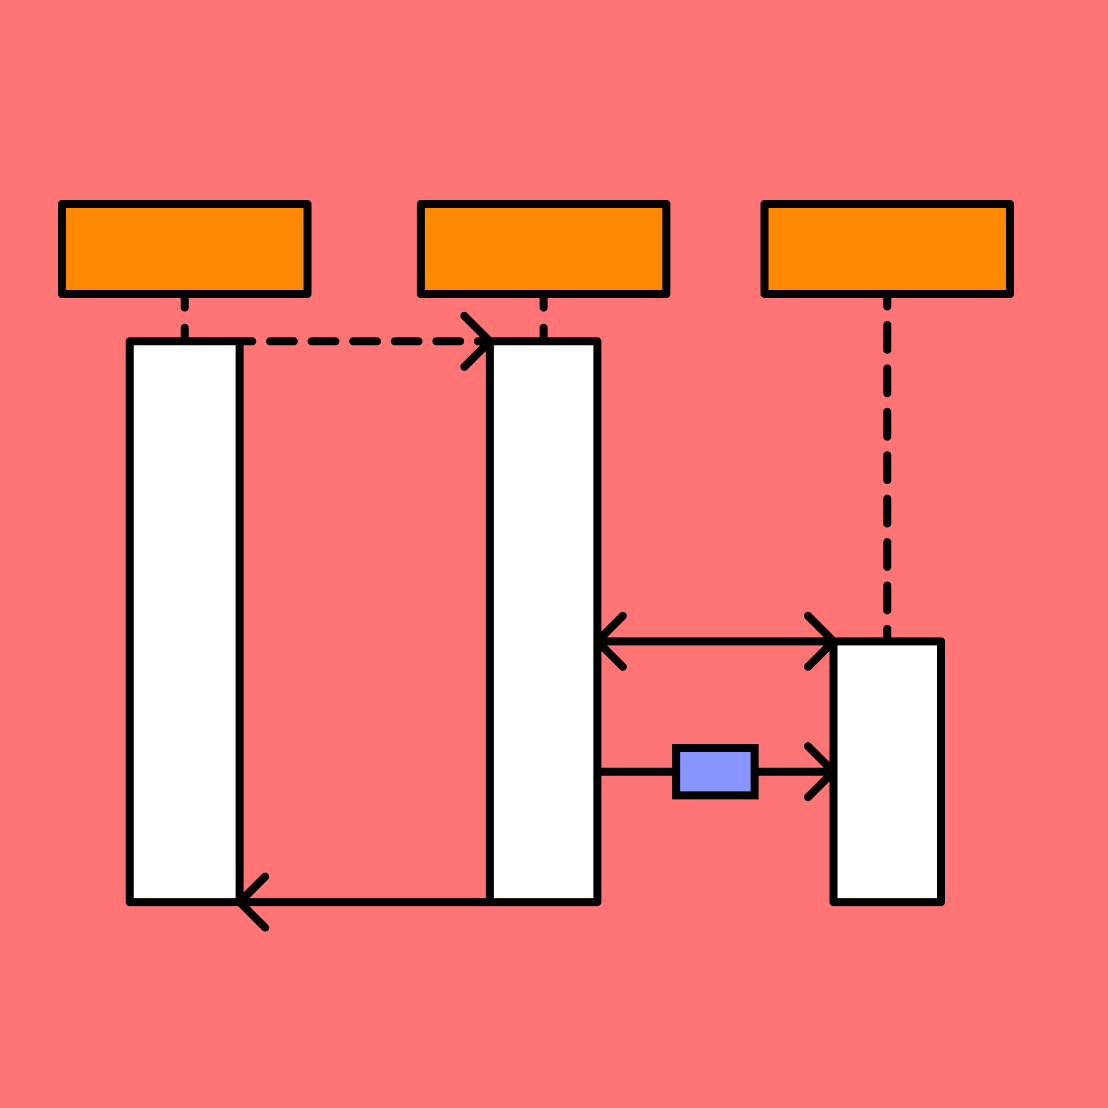
Writing out detailed steps in logical data flow diagrams requires in-depth knowledge. Bring all the experts into the room with a shared whiteboard from FigJam. Give and receive feedback via chat or audio, prompt your team with polls, and move box shapes around without making a mess.
Complex doesn’t have to mean complicated
Tackle intricate system analysis with straightforward data flow diagramming. Break your process down further with other templates from FigJam’s community members.


FAQs
In the world of data flow diagrams (DFDs), the “level” corresponds to the amount of detail. The higher the number, the more in-depth the diagram goes.
All data flow diagrams (DFDs) outline processes or systems in a series of steps. As you increase the “level” counter, you start to break each step down into sub-steps. A level 1 data flow diagram might list a processing step as “Place Order,” while a DFD level 2 diagram example would break that step into “Shopping Cart,” “Delivery Data,” and so on.
A level 1 data flow diagram is a less nuanced graphical representation of a level 2 DFD. The main “ideas” will all have sub-processes, but the information within each section will be less granular—there are no sub-sub-processes. In short, you’ll need a magnifying glass, not a microscope.
The simplest DFD, then, is at level 0. What is a level 0 diagram, you ask? Sometimes called a “context diagram,” these illustrations present the entire system or process as a single set of points. They remain high-level, making information quick and easy to relay when looking at a structured systems analysis.
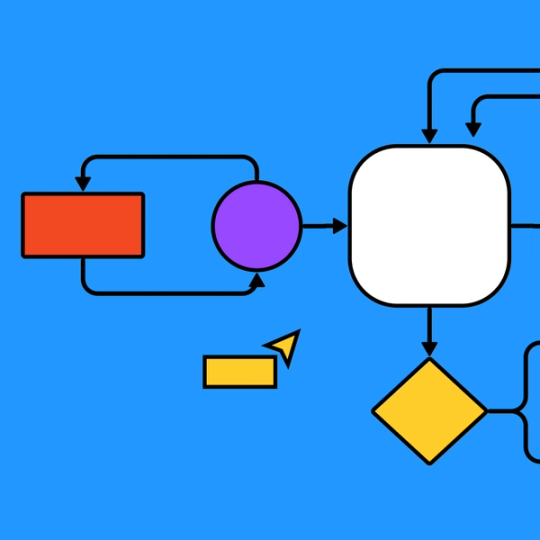
On the surface, data flow diagrams can feel dense. Search for a DFD level 2 tutorial, and you’ll inevitably have to read about the different rules and methods set by its inventors in the 1970s. But, in reality, all you need to create a level 2 DFD is a series of shapes, connectors, and individuals who understand the entire system and information flow.
With a FigJam whiteboard, all the guessing around squares, circles, and arrows is gone. Everything is already there for you—and it all snaps to the grid. You bring the experts, we’ll bring the shared interface for boundless creativity.
Other templates you might like


Explore 1,000+ templates on the Figma community
Explore even more templates, widgets, and plugins—all built by the Figma community.

